Open Access
Fig. 18.
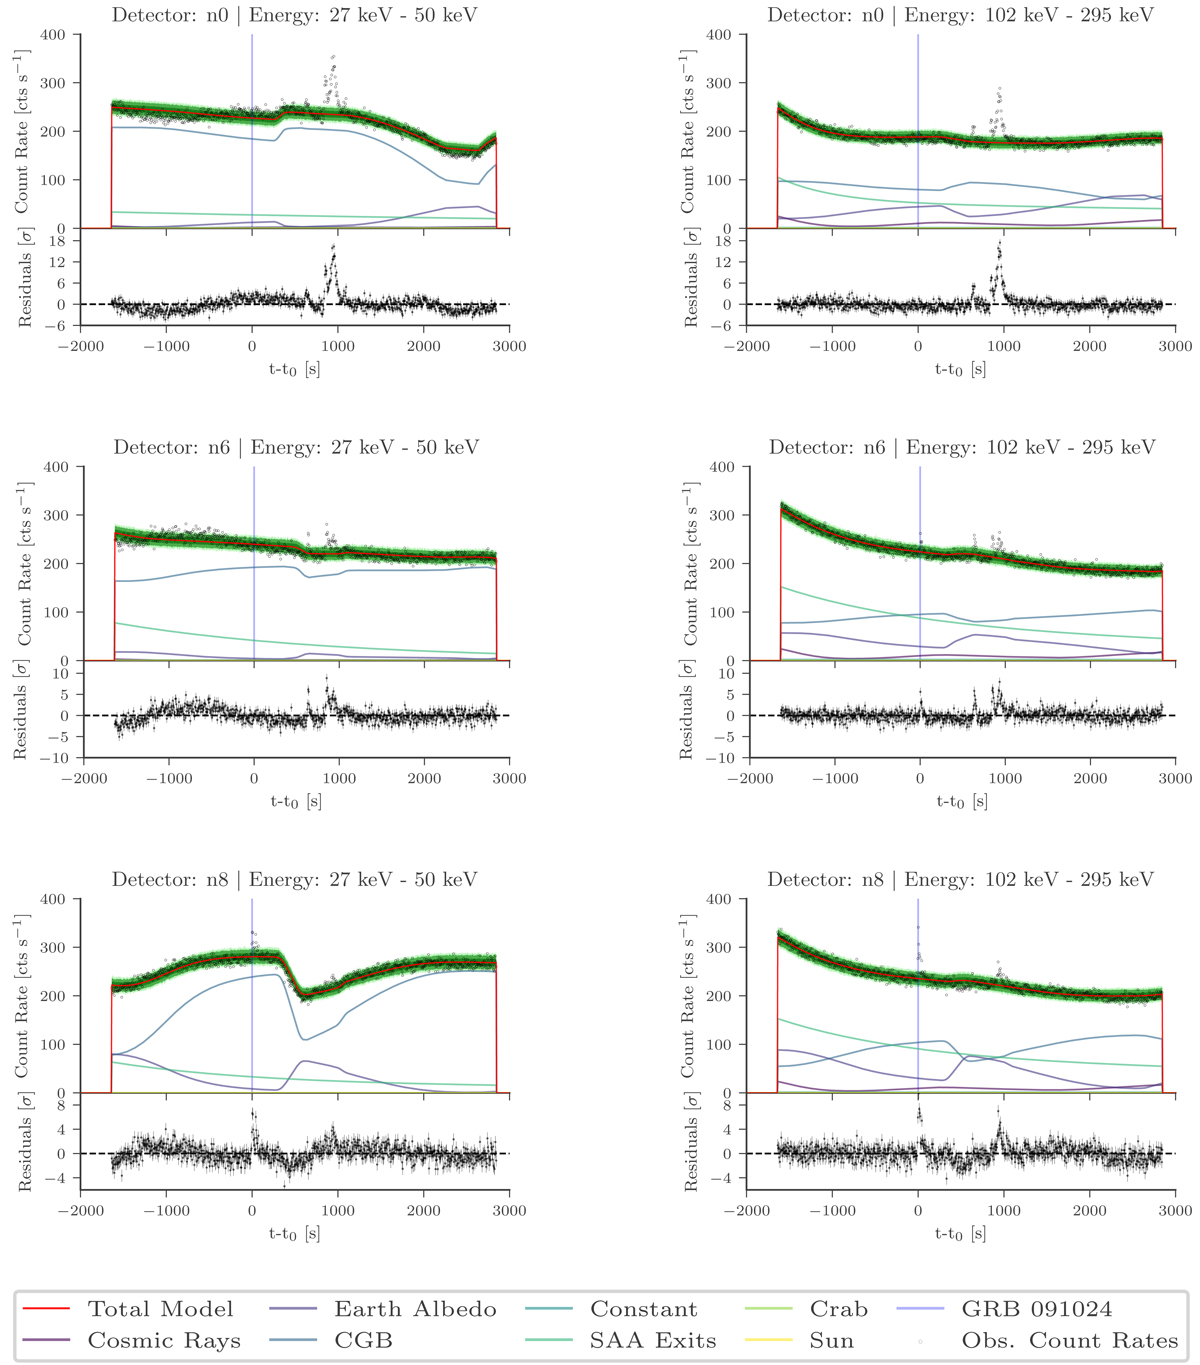
Data and background fits for the 5000 s around the GBM trigger time of GRB 091024 (t = 0) for three different detectors: (n0 (top), n6 (middle), n8 (bottom)), and two reconstructed energy ranges (27–50 keV (left) and 102–295 keV (right)).
Current usage metrics show cumulative count of Article Views (full-text article views including HTML views, PDF and ePub downloads, according to the available data) and Abstracts Views on Vision4Press platform.
Data correspond to usage on the plateform after 2015. The current usage metrics is available 48-96 hours after online publication and is updated daily on week days.
Initial download of the metrics may take a while.