Fig. 16.
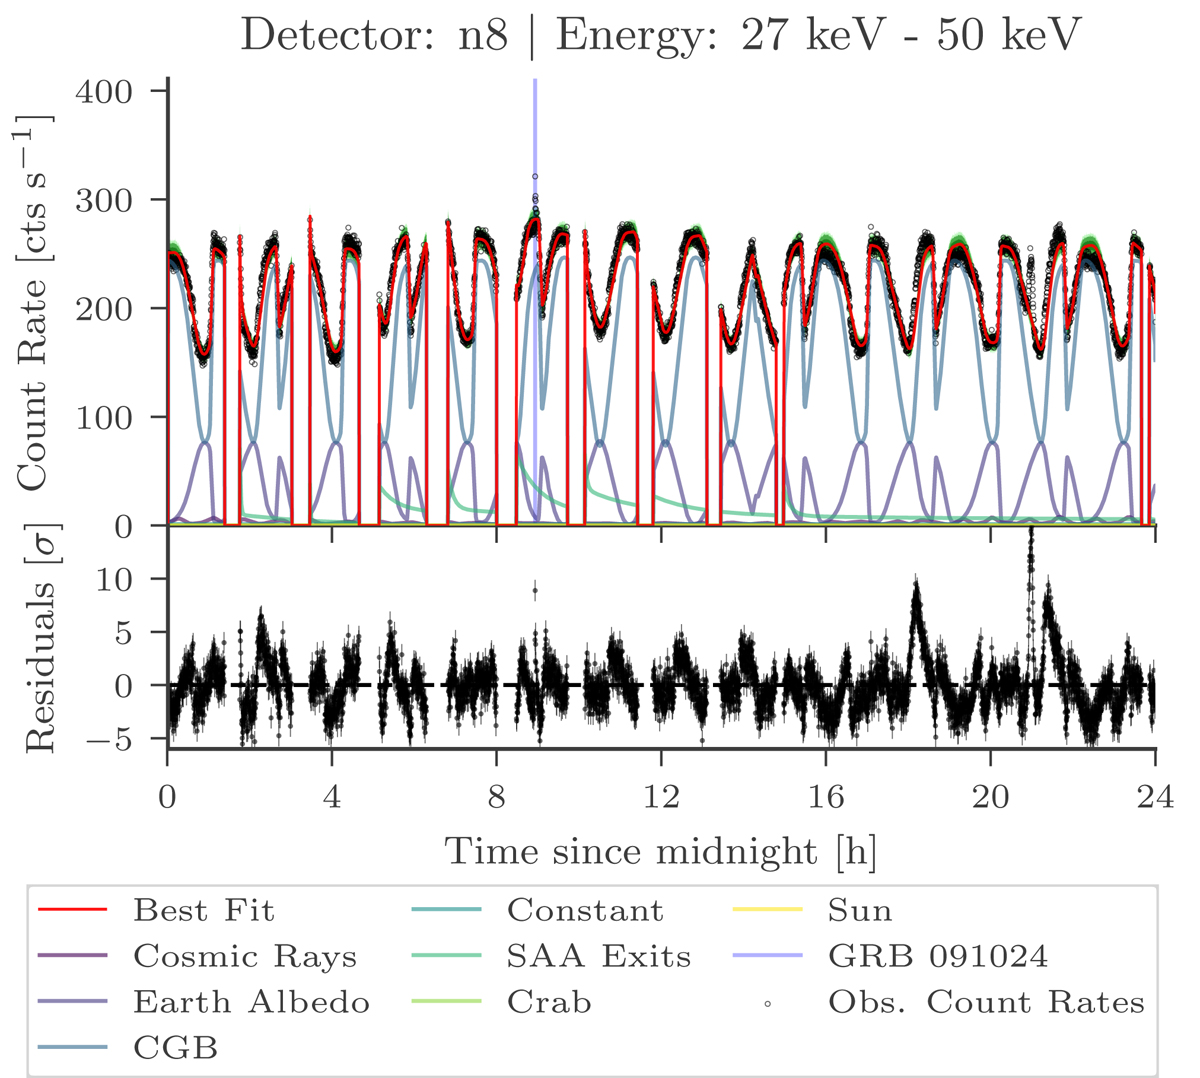
Data and background fit for 24/10/2009 including the ultra-long GRB 091024 for detector n8 in the reconstructed energy range of 27–50 keV with a time-bin size of 15 s. The plot shows the influence of the different sources in different colors, the best-fit total model in red, and the detected count rates in black. The GBM trigger time of GRB 091024 is indicated by a cyan line.
Current usage metrics show cumulative count of Article Views (full-text article views including HTML views, PDF and ePub downloads, according to the available data) and Abstracts Views on Vision4Press platform.
Data correspond to usage on the plateform after 2015. The current usage metrics is available 48-96 hours after online publication and is updated daily on week days.
Initial download of the metrics may take a while.