Fig. 15.
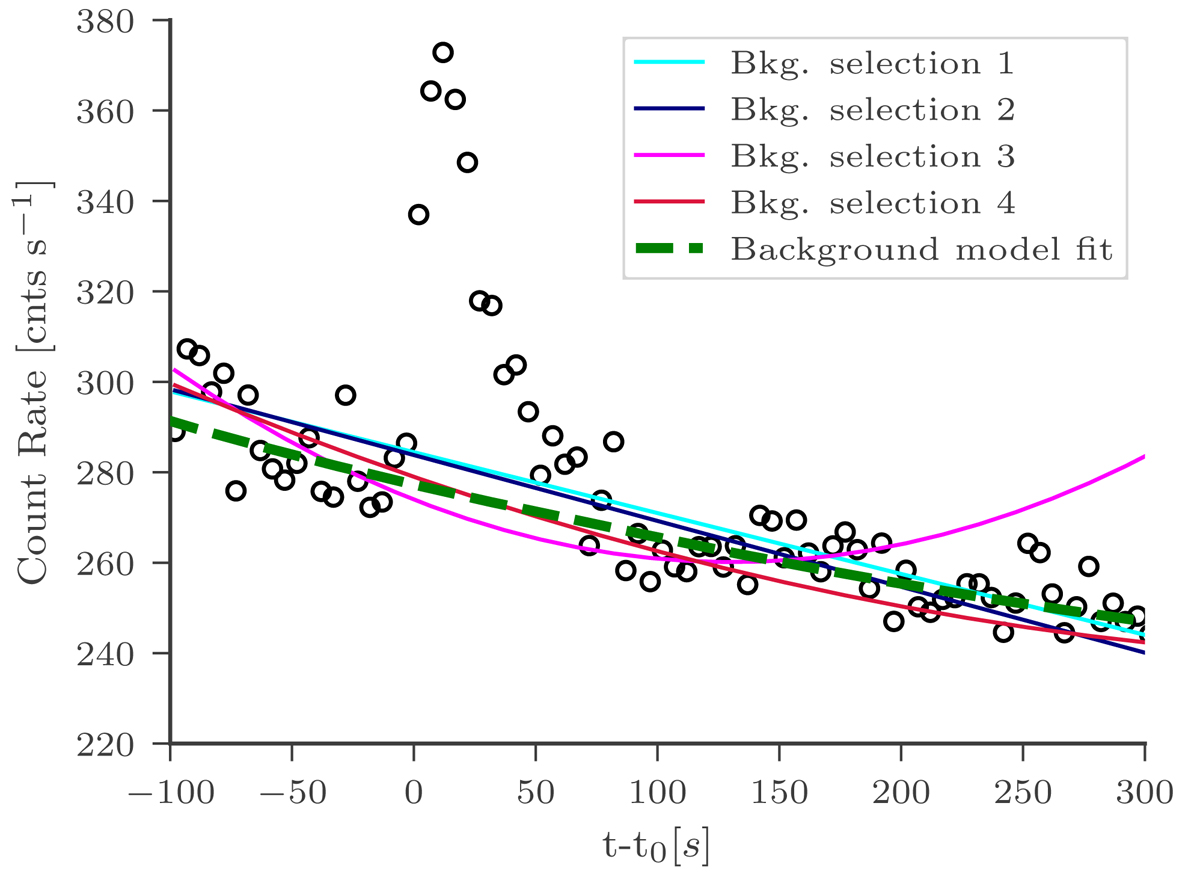
Data and different background estimations for the time around GRB 110920A in the reconstructed energy range from 102 to 295 keV for detector na with a time-bin size of 5 s. The four solid lines are derived with the classical approach of fitting polynomials to the time before after the transient event, each with a different definition of these times (1: −100 s to −90 s and 150 s to 200 s; 2: −100 s to −70 s and 50 s to 200 s; 3: −100 s to 0 s and 100 s to 200 s; 4: −100 s to −50 s and 400 s to 500 s). Additionally the best fit of our background model is plotted as a dashed green line.
Current usage metrics show cumulative count of Article Views (full-text article views including HTML views, PDF and ePub downloads, according to the available data) and Abstracts Views on Vision4Press platform.
Data correspond to usage on the plateform after 2015. The current usage metrics is available 48-96 hours after online publication and is updated daily on week days.
Initial download of the metrics may take a while.