Fig. B.1.
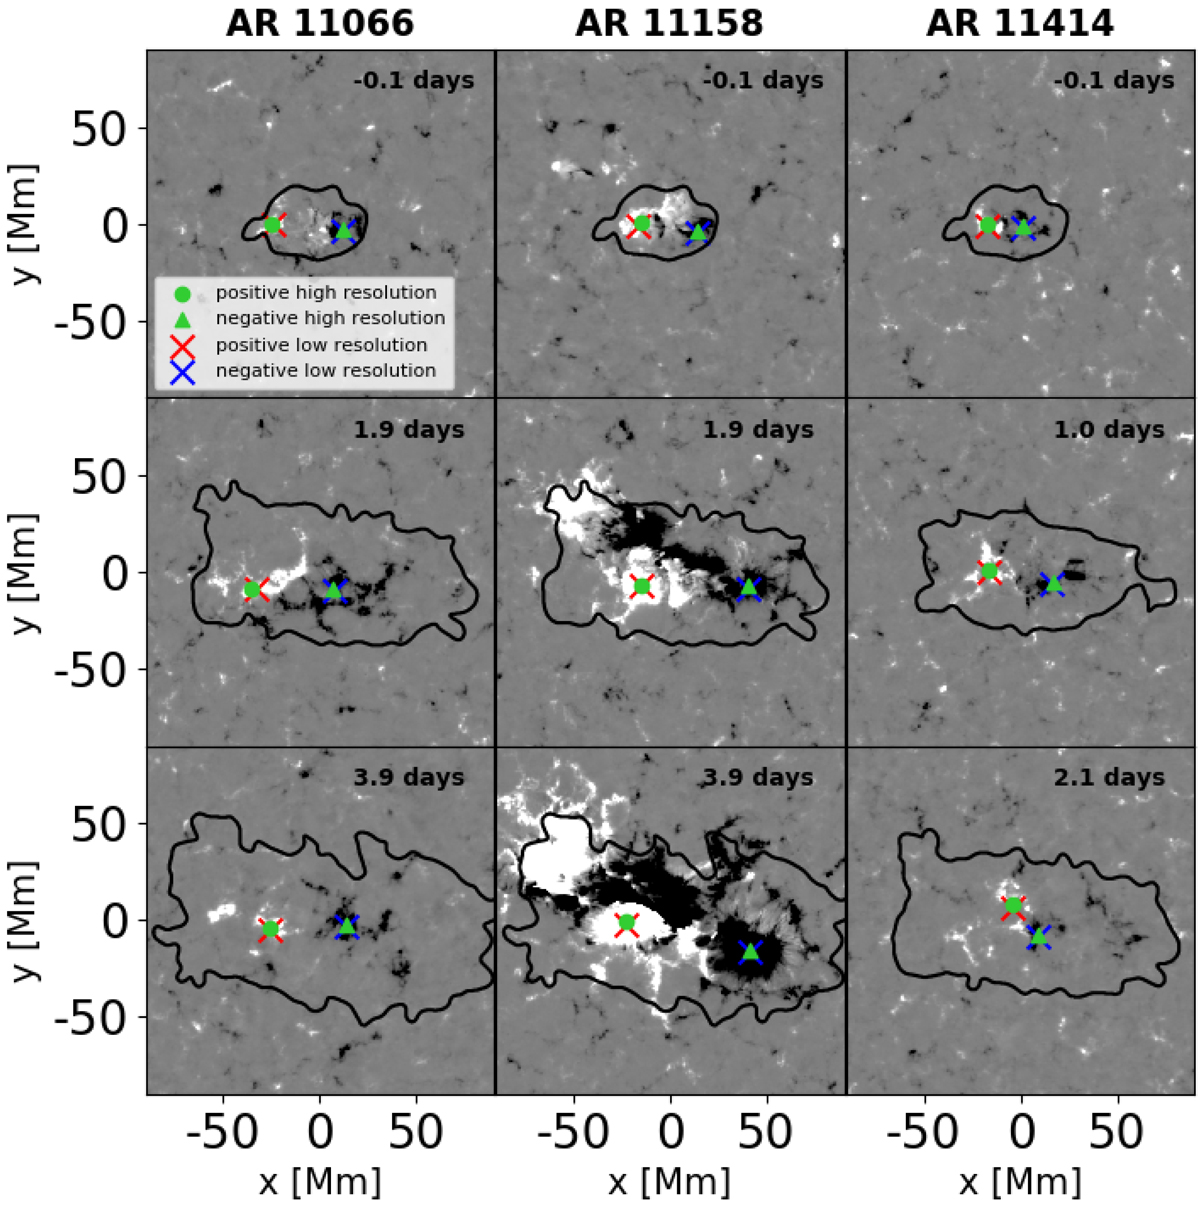
Similar to Fig. 1 in Schunker et al. (2019). High-resolution (0.35 Mm per pixel) time-averaged line-of-sight magnetogram maps of AR 11066 (left), AR 11158 (middle), and AR 11414 (right). These high-resolution maps can be directly compared with the low-resolution maps in Fig. 1 in Schunker et al. (2019). The grey scale is ±1000 G. The black contour indicates the search area to identify the polarities in the high-resolution maps. The green triangle (circle) shows the position of the negative (positive) polarity identified using the high-resolution maps. The position of the negative (blue cross) and positive (red cross) polarities computed from the low-resolution (1.4 Mm per pixel) time-averaged line-of-sight magnetograms are shown for comparison.
Current usage metrics show cumulative count of Article Views (full-text article views including HTML views, PDF and ePub downloads, according to the available data) and Abstracts Views on Vision4Press platform.
Data correspond to usage on the plateform after 2015. The current usage metrics is available 48-96 hours after online publication and is updated daily on week days.
Initial download of the metrics may take a while.