Fig. A.2.
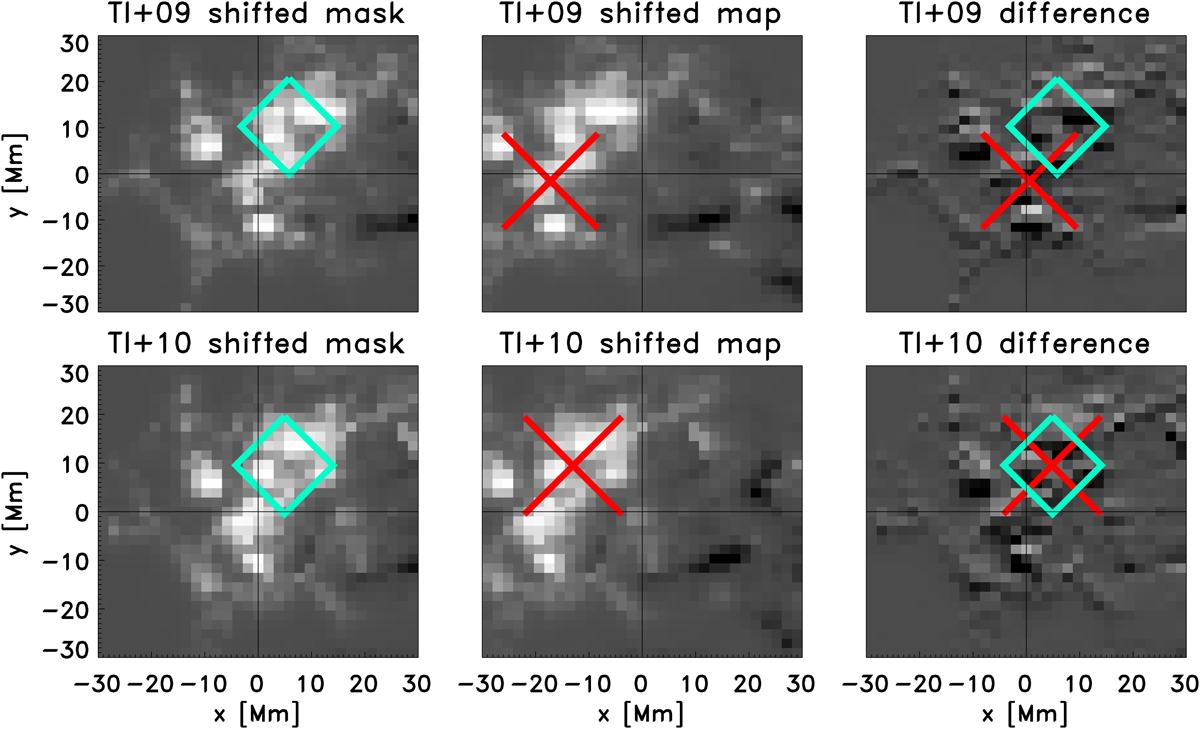
Line-of-sight magnetic field maps and identified locations of the positive (following) polarity at TI+09 (top row) and TI+10 (bottom row) of example active region 11072. The greyscale is from −500 G to 1200 G. Left panel: map and location of the polarity (teal diamond) by shifting the search mask. Middle panel: location of the polarity (red cross) after shifting the magnetic field map using bilinear interpolation. The size of the symbol is proportional to the radius of the detected feature. Right panel: difference accounting for the integer shift in the maps. The root mean square of the difference map is 147 G. The largest absolute difference (> 900 G) occurs in the white region below the red cross in the TI+09 difference map.
Current usage metrics show cumulative count of Article Views (full-text article views including HTML views, PDF and ePub downloads, according to the available data) and Abstracts Views on Vision4Press platform.
Data correspond to usage on the plateform after 2015. The current usage metrics is available 48-96 hours after online publication and is updated daily on week days.
Initial download of the metrics may take a while.