Fig. 5.
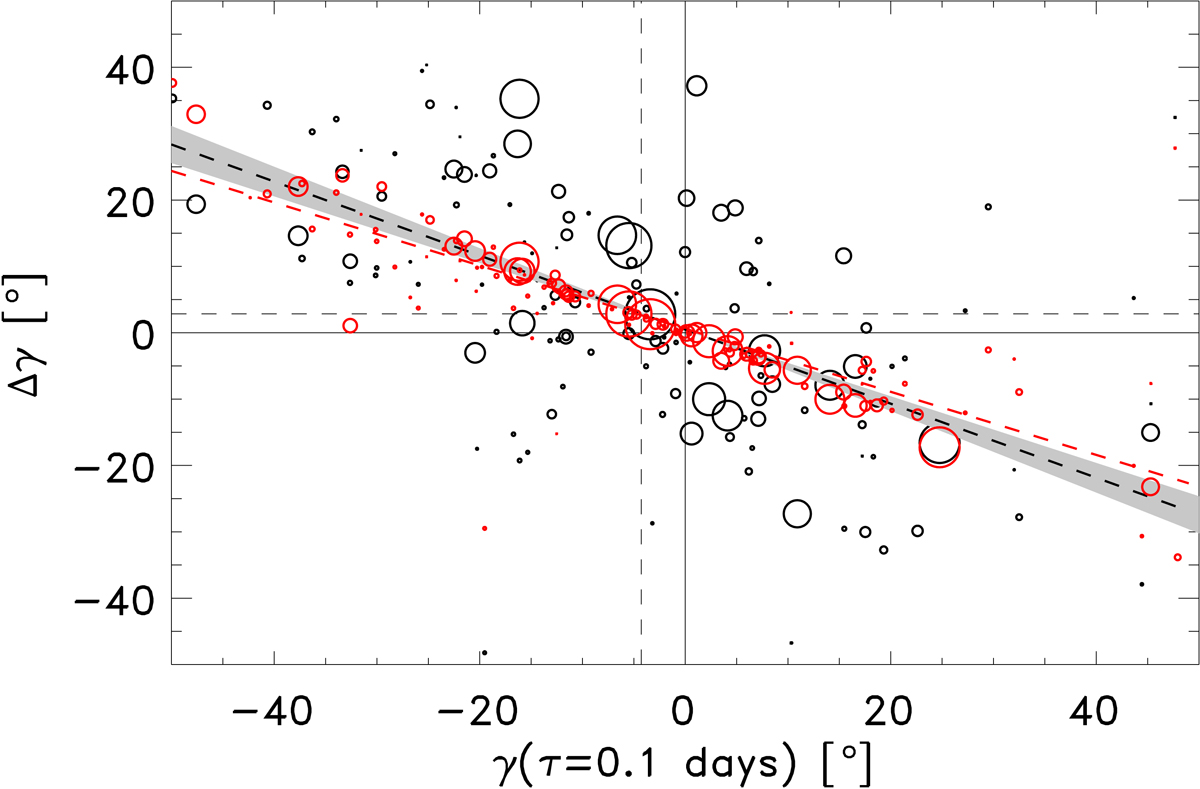
Change in tilt angle, Δγ, between τ = 2.1 day and τ = 0.1 day as a function of the tilt angle, γ, at the emergence time (grey circles). The size of the circle represents the maximum flux of the active region. The dotted grey line is a linear best fit to the observed Δγ (grey circles) with a slope of −0.65 ± 0.06, and the shaded grey area indicates the uncertainty in the fitted slope parameter. The red circles are the expected change in tilt angle for each EAR if only δx changed and δy remained constant (see Eq. (2)). The red dotted line is a linear best fit to the red circles with slope −0.52 ± 0.06.
Current usage metrics show cumulative count of Article Views (full-text article views including HTML views, PDF and ePub downloads, according to the available data) and Abstracts Views on Vision4Press platform.
Data correspond to usage on the plateform after 2015. The current usage metrics is available 48-96 hours after online publication and is updated daily on week days.
Initial download of the metrics may take a while.