Fig. 3.
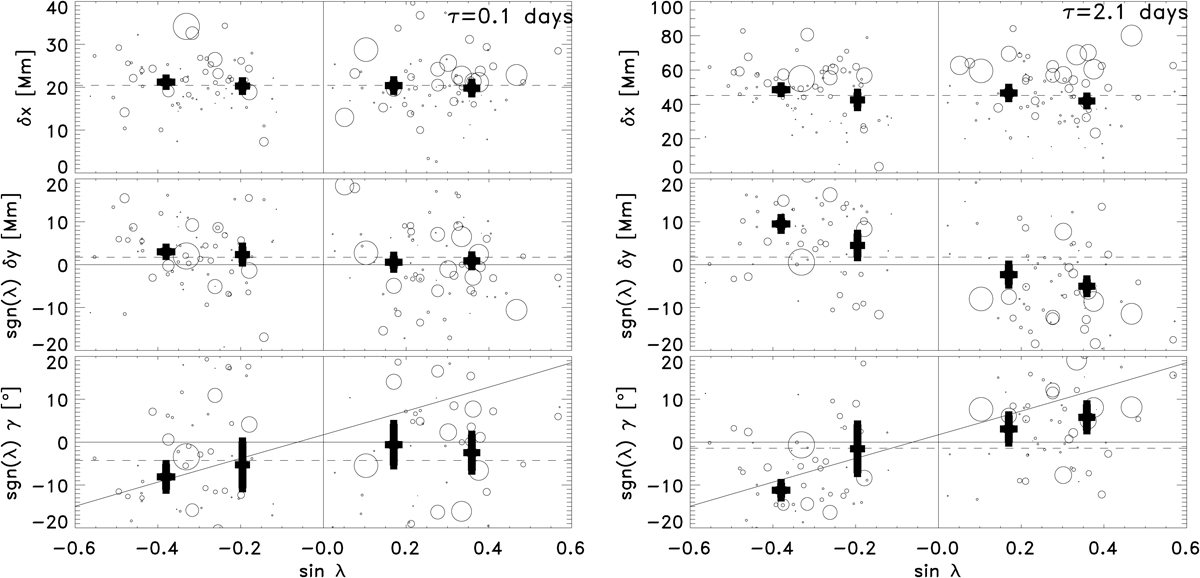
East-west separation, δx (top); north-south separation, δy (middle); and tilt angle, γ (bottom) of the polarities as a function of latitude, λ, at the emergence time (left) and two days later (right). The sign of the north-south separation and the tilt angle of active regions in the southern hemisphere have been adjusted, i.e. in the southern (northern) hemisphere a negative (positive) δy and a negative (positive) γ is consistent with Joy’s law (black curve, Wang & Sheeley 1991). The size of the circle is proportional to the maximum flux of the active region. The thick black points with error bars show latitudinal averages between 0 and 15° (sin λ = 0.26) and 15° to 40° (sin λ = 0.64) in the northern hemisphere, and the equivalent in the southern hemisphere. The dashed lines are the mean values.
Current usage metrics show cumulative count of Article Views (full-text article views including HTML views, PDF and ePub downloads, according to the available data) and Abstracts Views on Vision4Press platform.
Data correspond to usage on the plateform after 2015. The current usage metrics is available 48-96 hours after online publication and is updated daily on week days.
Initial download of the metrics may take a while.