Fig. 2.
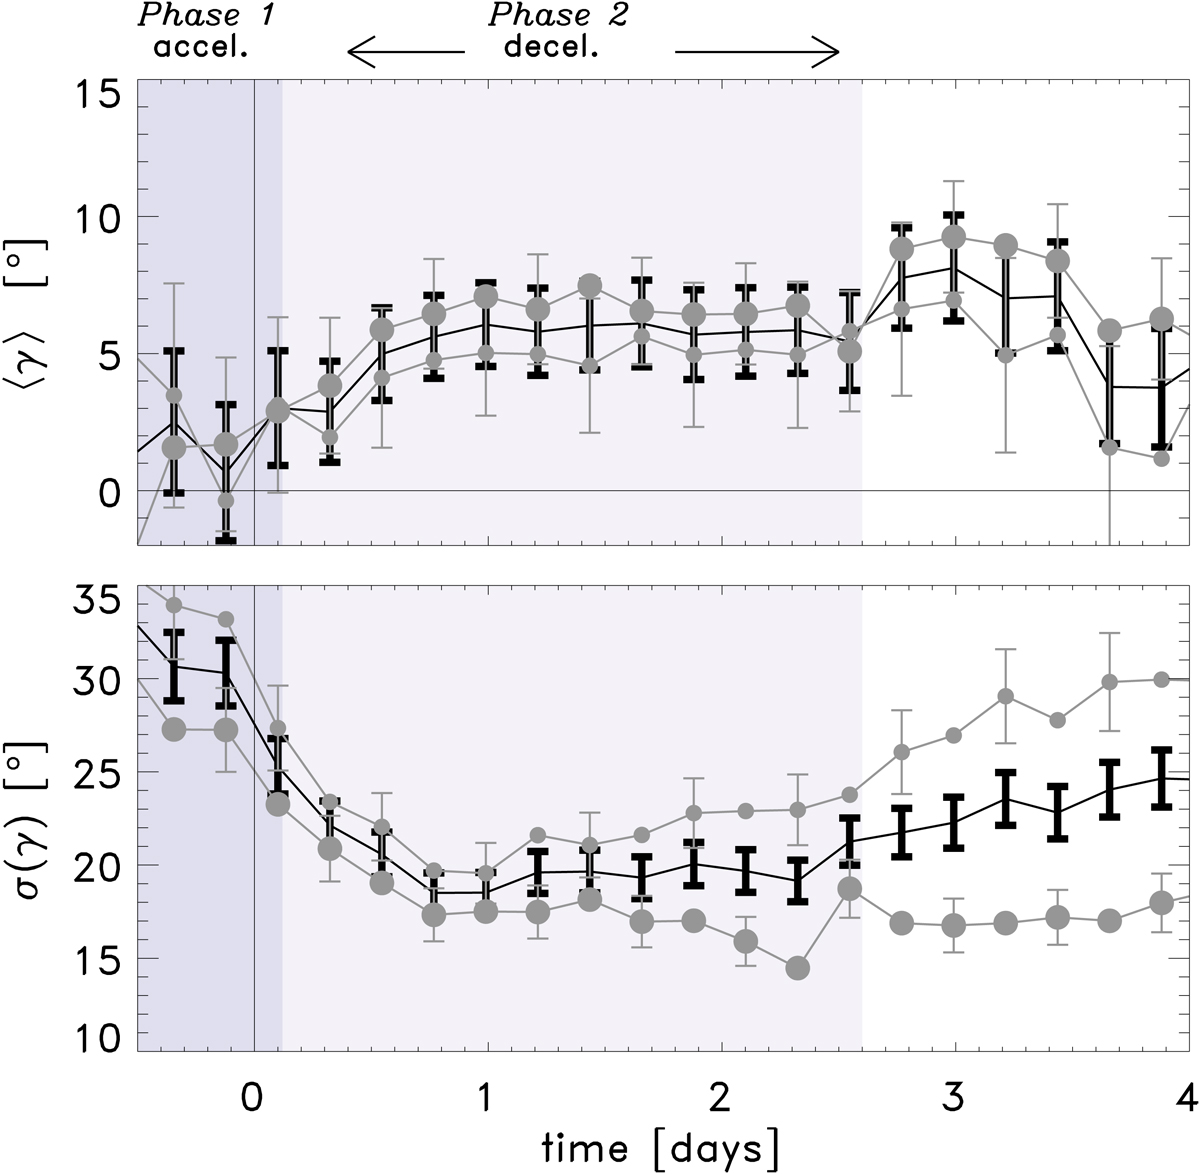
Averaged tilt angle (top) and standard deviation of the tilt angle (bottom) of the polarities as a function of time for all EARs (black), EARs with a higher (lower) maximum flux than the median in large grey circles (small grey circles). The EARs are divided into higher than or equal to, and lower than, the median maximum flux value, 4.6 × 10²¹ Mx. The standard deviation of the sample standard deviation at each time interval is described in Schunker et al. (2019, Appendix E). The shaded regions indicate two different phases of emergence, an increasing separation speed between the polarities followed by a decreasing separation speed (Schunker et al. 2019).
Current usage metrics show cumulative count of Article Views (full-text article views including HTML views, PDF and ePub downloads, according to the available data) and Abstracts Views on Vision4Press platform.
Data correspond to usage on the plateform after 2015. The current usage metrics is available 48-96 hours after online publication and is updated daily on week days.
Initial download of the metrics may take a while.