Fig. C.2.
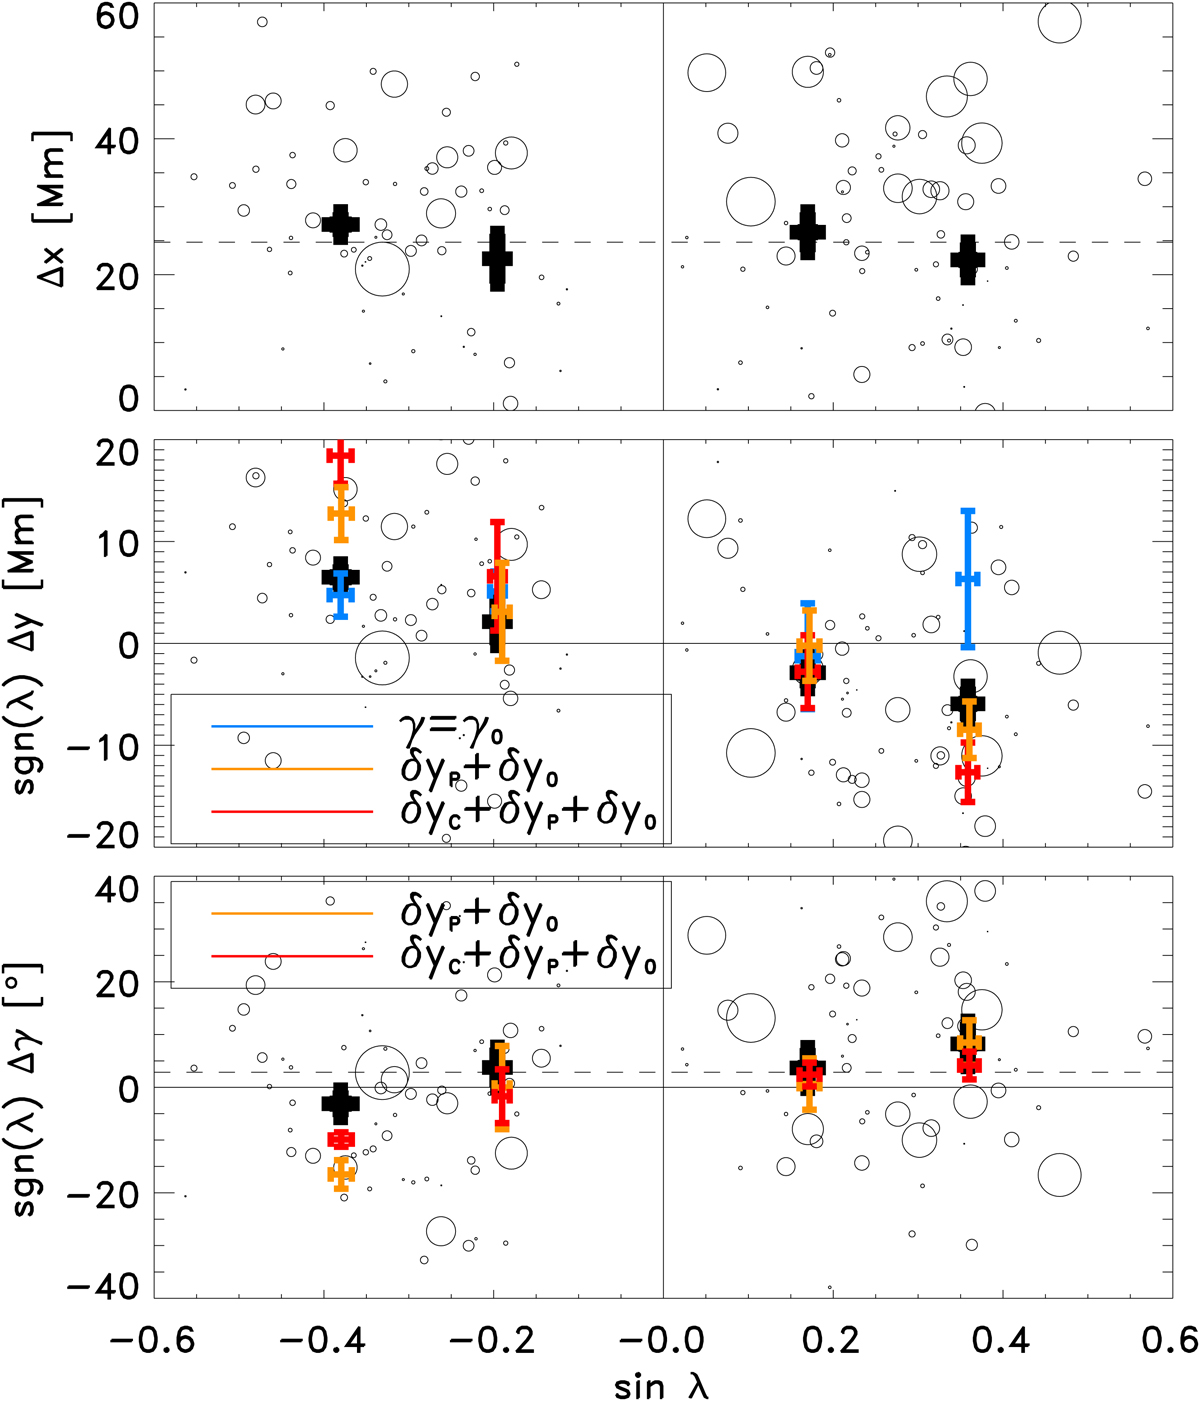
Change in east-west separation, Δx, (top panel); north-south separation, Δy, (second panel); and change in tilt angle, Δγ (bottom panel) in the first two days after emergence as a function of latitude, λ. The size of the circle is proportional to the maximum flux of the active region. The thick black points with error bars show the averages for active regions in different latitude ranges. The coloured points with error bars show latitudinal averages (between 0° and 15° (sin λ = 0.26) and 15° and 40° (sin λ = 0.64) in the northern hemisphere, and the equivalent in the southern hemisphere) for the modelled north-south separation and change in tilt angle for the constant tilt angle model in blue, the Coriolis effect in red, and the initial north-south velocity of the polarities in yellow.
Current usage metrics show cumulative count of Article Views (full-text article views including HTML views, PDF and ePub downloads, according to the available data) and Abstracts Views on Vision4Press platform.
Data correspond to usage on the plateform after 2015. The current usage metrics is available 48-96 hours after online publication and is updated daily on week days.
Initial download of the metrics may take a while.