Fig. C.1.
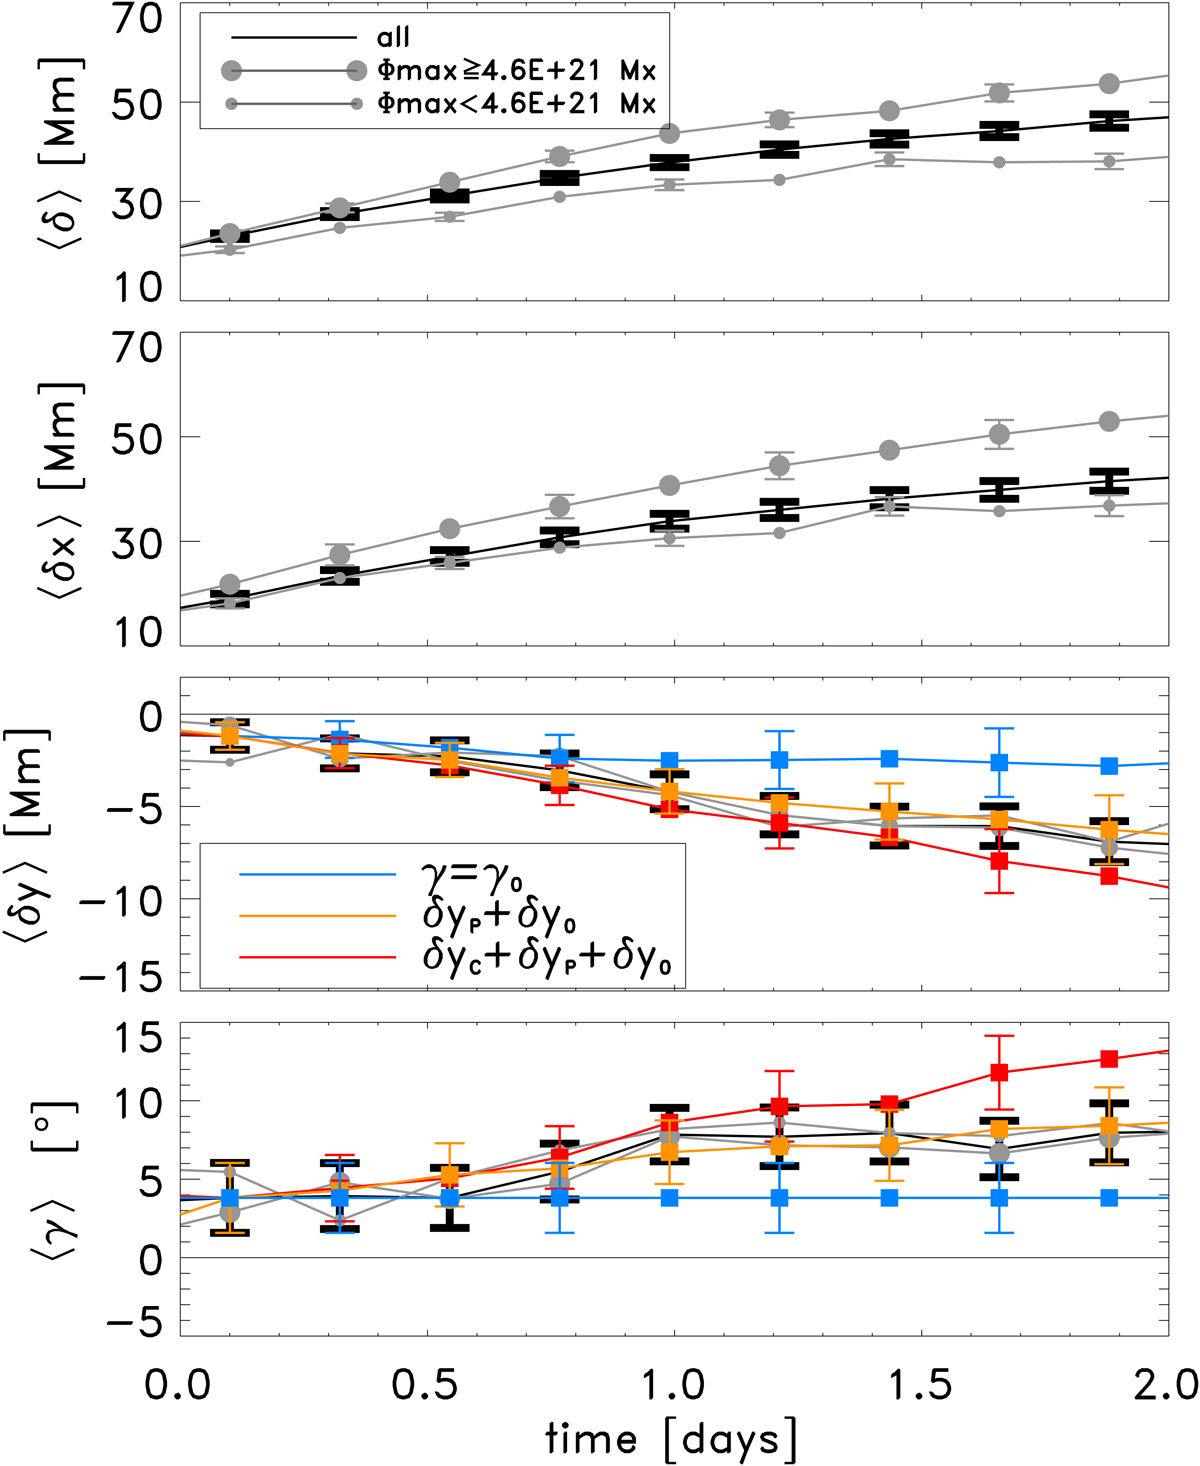
Median separation (top three panels) and tilt angle (bottom panel) of 95 EARs with valid measurements of their location at all times from τ = 0.1 to τ = 2.1 days (black curve). This is less than the 153 active regions used in the body of the paper because in this case the EAR is required to have a valid measurement at all time intervals shown. This does not change the results significantly from using all EARs with valid measurements at each time. High- and low-flux observation samples are indicated by the size of the grey circles. Bottom two panels: the coloured curves show the different models of displacement and tilt angle, and grey represents the observations.
Current usage metrics show cumulative count of Article Views (full-text article views including HTML views, PDF and ePub downloads, according to the available data) and Abstracts Views on Vision4Press platform.
Data correspond to usage on the plateform after 2015. The current usage metrics is available 48-96 hours after online publication and is updated daily on week days.
Initial download of the metrics may take a while.