Fig. B.2.
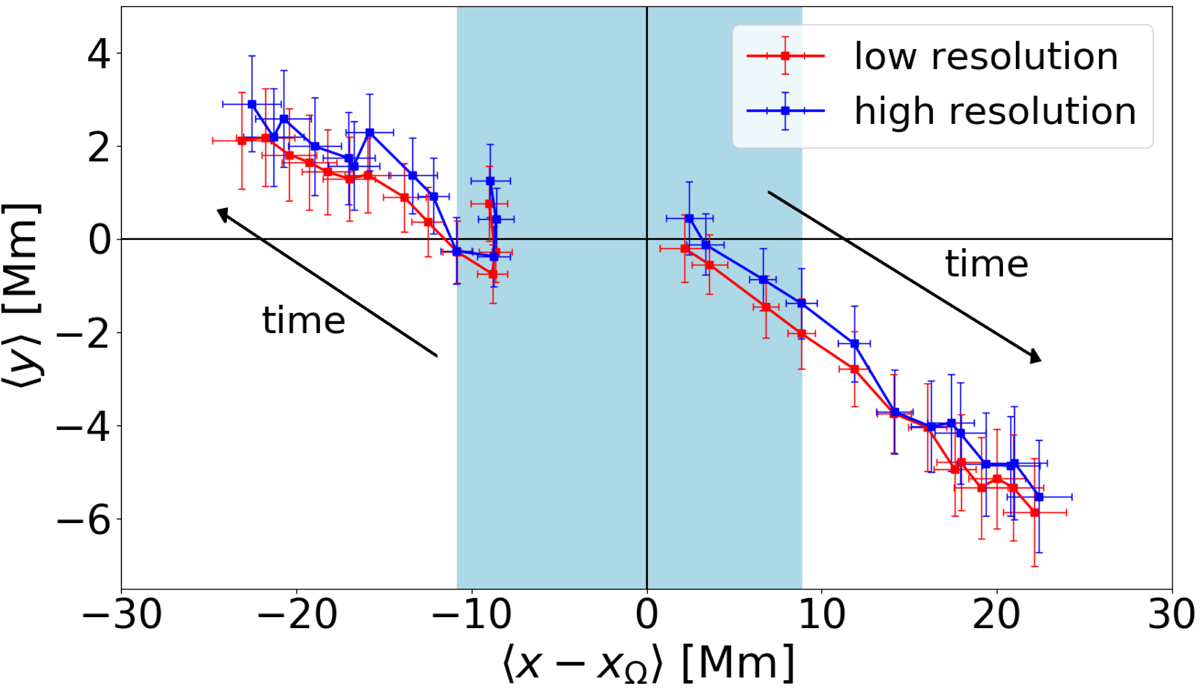
Average position of the polarities from τ = −18.4 h (three time intervals, TI-03) before the emergence time, until τ = 2.1 days after (TI+09) increasing in distance away from the centre. This figure is similar to Fig. 2 Schunker et al. (2019), except that only 78 of the emerging active regions have been used in both the low- and high-resolution cases (red and blue, respectively). Differences between the high- and low-resolution cases do not change our previous science conclusions or about the onset of Joy’s law. The blue shaded region indicates Phase 1 of the emergence process (Schunker et al. 2019) when the polarity separation speed is increasing.
Current usage metrics show cumulative count of Article Views (full-text article views including HTML views, PDF and ePub downloads, according to the available data) and Abstracts Views on Vision4Press platform.
Data correspond to usage on the plateform after 2015. The current usage metrics is available 48-96 hours after online publication and is updated daily on week days.
Initial download of the metrics may take a while.