Fig. 5.
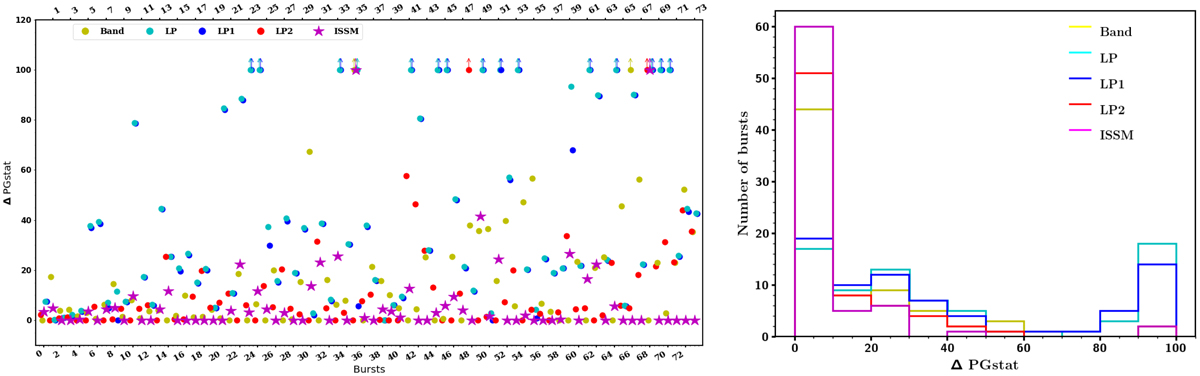
Left: difference in PGstat of the five models with respect to the model with the lowest PGstat, for every GRB displayed with increasing SNR (increasing from the left to the right). For each GRB, the five model markers are displayed within two vertical (red and blue) lines. By definition, the model with the lowest PGstat is always placed on the zero horizontal line. Lower limits at the top of the figure stand for models with a Δ PGstat larger than 100. Right: distribution of Δ PGstat for the five models.
Current usage metrics show cumulative count of Article Views (full-text article views including HTML views, PDF and ePub downloads, according to the available data) and Abstracts Views on Vision4Press platform.
Data correspond to usage on the plateform after 2015. The current usage metrics is available 48-96 hours after online publication and is updated daily on week days.
Initial download of the metrics may take a while.