Fig. 3.
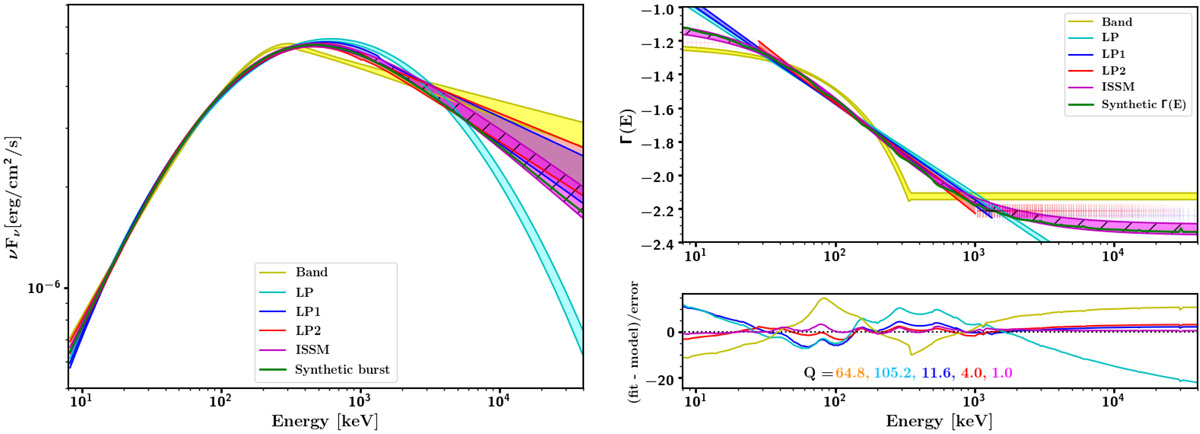
Left: SEDs of the GRB_B010 synthetic burst in the time interval [1 s, 3 s], from fits with the five spectral functions. The fit with the ISSMfunction is presented by the hatched magenta line. Right: local photon index as a function of the photon energy. The fit quality factor Q of the five functions is given in the bottom panel.
Current usage metrics show cumulative count of Article Views (full-text article views including HTML views, PDF and ePub downloads, according to the available data) and Abstracts Views on Vision4Press platform.
Data correspond to usage on the plateform after 2015. The current usage metrics is available 48-96 hours after online publication and is updated daily on week days.
Initial download of the metrics may take a while.