Fig. 1.
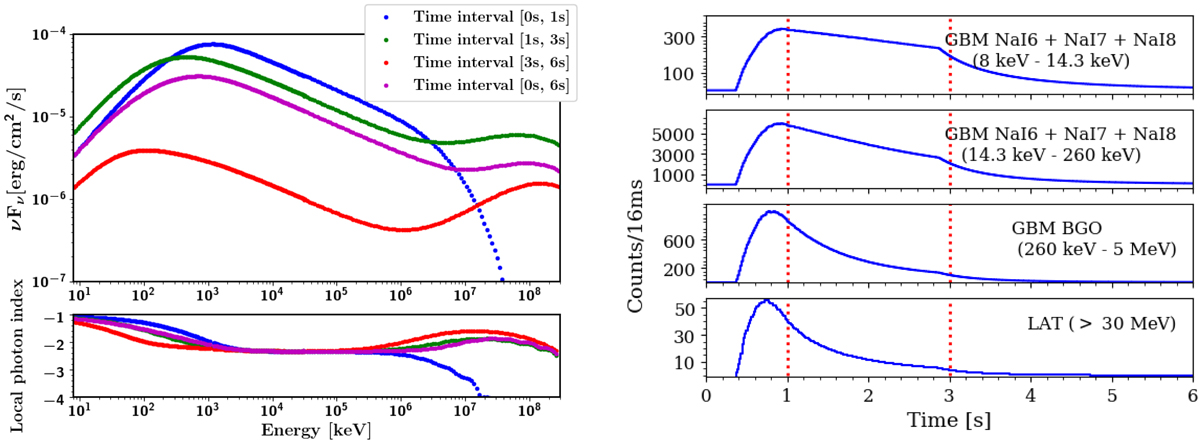
Left: spectral energy distributions of the synthetic burst GRB_B010 and local photon index in the four time intervals [0 s, 1 s], [1 s, 3 s], [3 s, 6 s] and [0 s, 6 s]. Right: multi-detector light curves of GRB_B010: summed counts in two energy ranges of GBM/NaI detectors (first two panels), in the GBM/BGO energy range (third panel) and using the largest LAT energy range (> 30 MeV) (bottom panel). The red dashed lines show the boundaries of the three time intervals [0 s, 1 s], [1 s, 3 s] and [3 s, 6 s].
Current usage metrics show cumulative count of Article Views (full-text article views including HTML views, PDF and ePub downloads, according to the available data) and Abstracts Views on Vision4Press platform.
Data correspond to usage on the plateform after 2015. The current usage metrics is available 48-96 hours after online publication and is updated daily on week days.
Initial download of the metrics may take a while.