Fig. 4.
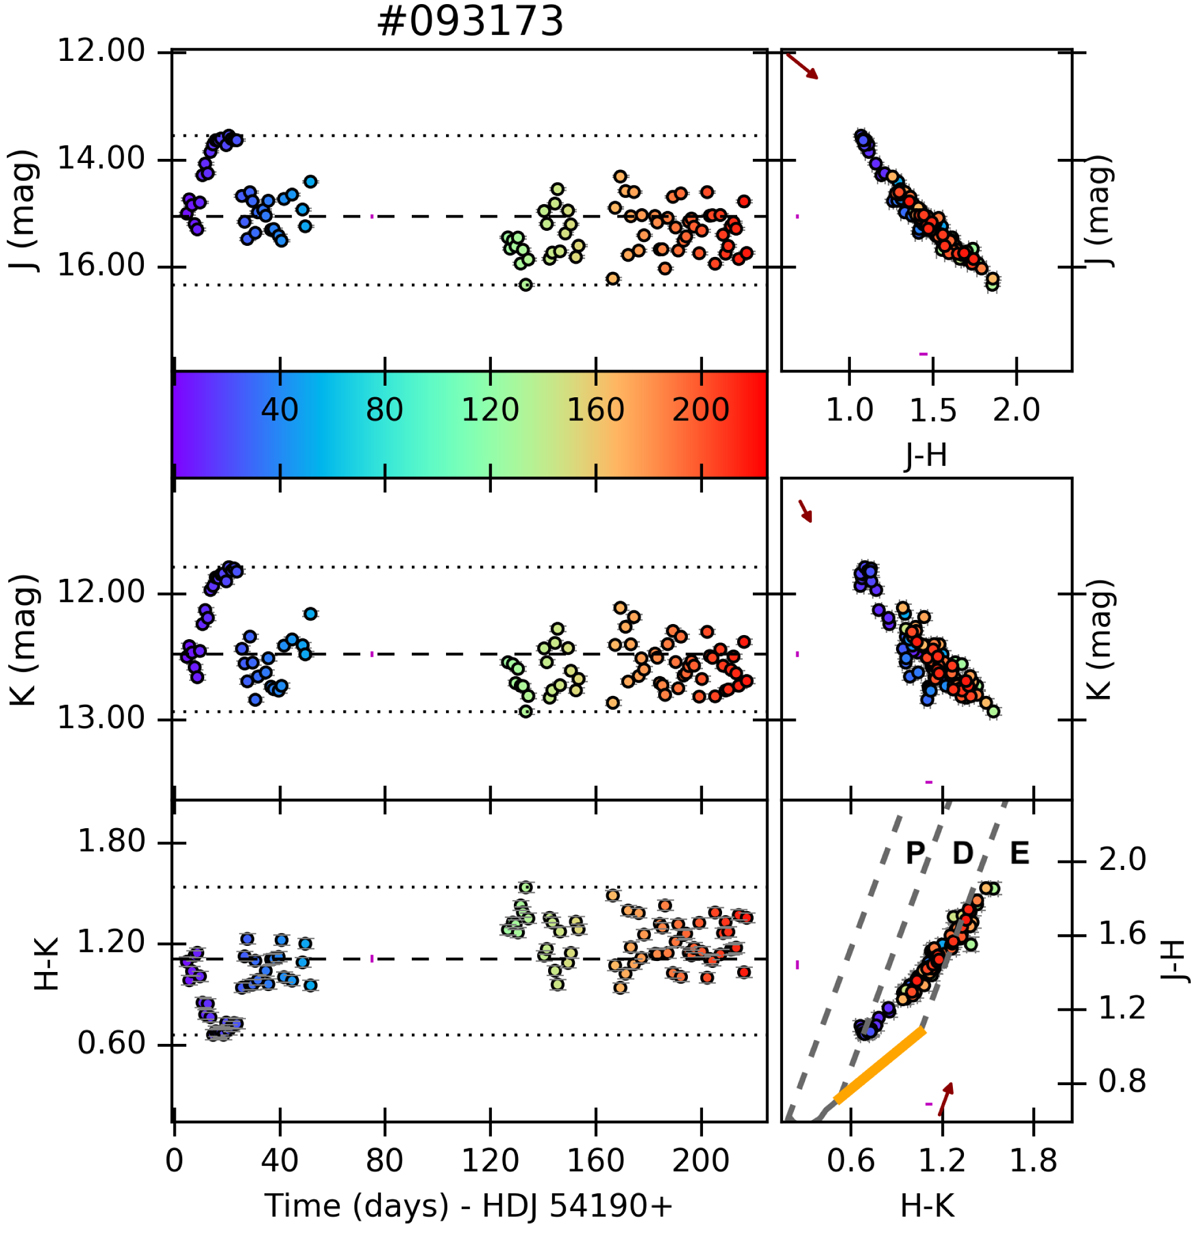
Star CygOB2-093173 is a disk-bearing (Class II) star and an example of non periodic variable star, with S = 15.64, and that presents reddening linear trajectories in the color-color and color-magnitude diagrams. Left, from top to bottom: J light curve, a color bar showing the color attributed for each observation date, K light curve, and H − K color curve. The dotted lines show maximum and minimum values in each light curves, and dashed lines show the median values. Right, from top to bottom: J vs. J − H color-magnitude diagram, K vs. H − K color-magnitude diagram, and color-color diagram with P, D, and E regions (discussed in Sect. 2). The dark red arrows show the effect of an interstellar reddening of AV = 2m. The vertical and horizontal magenta line segments show the median error in each axis. In each plot, error bars are shown in gray. When visible and close to the position of the star, a gray curve shows a Kraus & Hillenbrand (2007) empirical isochrone in the color-color diagram, and the orange line shows the T Tauri Locus. Each diagram has a range of 5σ around the median color or magnitude for that star.
Current usage metrics show cumulative count of Article Views (full-text article views including HTML views, PDF and ePub downloads, according to the available data) and Abstracts Views on Vision4Press platform.
Data correspond to usage on the plateform after 2015. The current usage metrics is available 48-96 hours after online publication and is updated daily on week days.
Initial download of the metrics may take a while.