Free Access
Fig. 3.
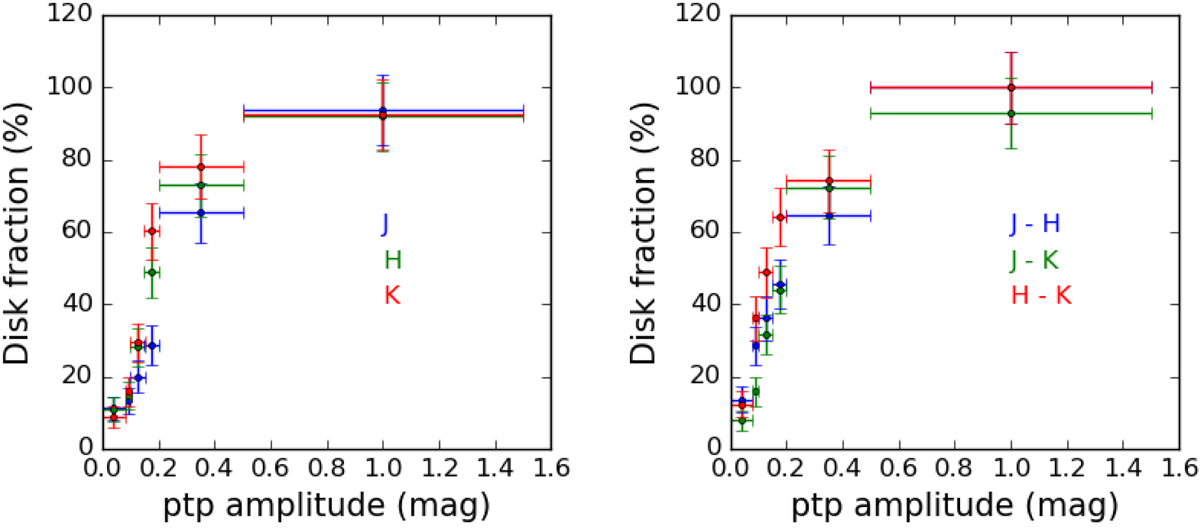
Disk fraction as a function of peak to peak amplitude for each near-IR band (left) and color (right). In both plots, circles show the center of each ptp amplitude bin and horizontal bars indicate the size of each bin. Vertical bars show the standard errors of a Poisson counting in that bin.
Current usage metrics show cumulative count of Article Views (full-text article views including HTML views, PDF and ePub downloads, according to the available data) and Abstracts Views on Vision4Press platform.
Data correspond to usage on the plateform after 2015. The current usage metrics is available 48-96 hours after online publication and is updated daily on week days.
Initial download of the metrics may take a while.