Free Access
Fig. 15.
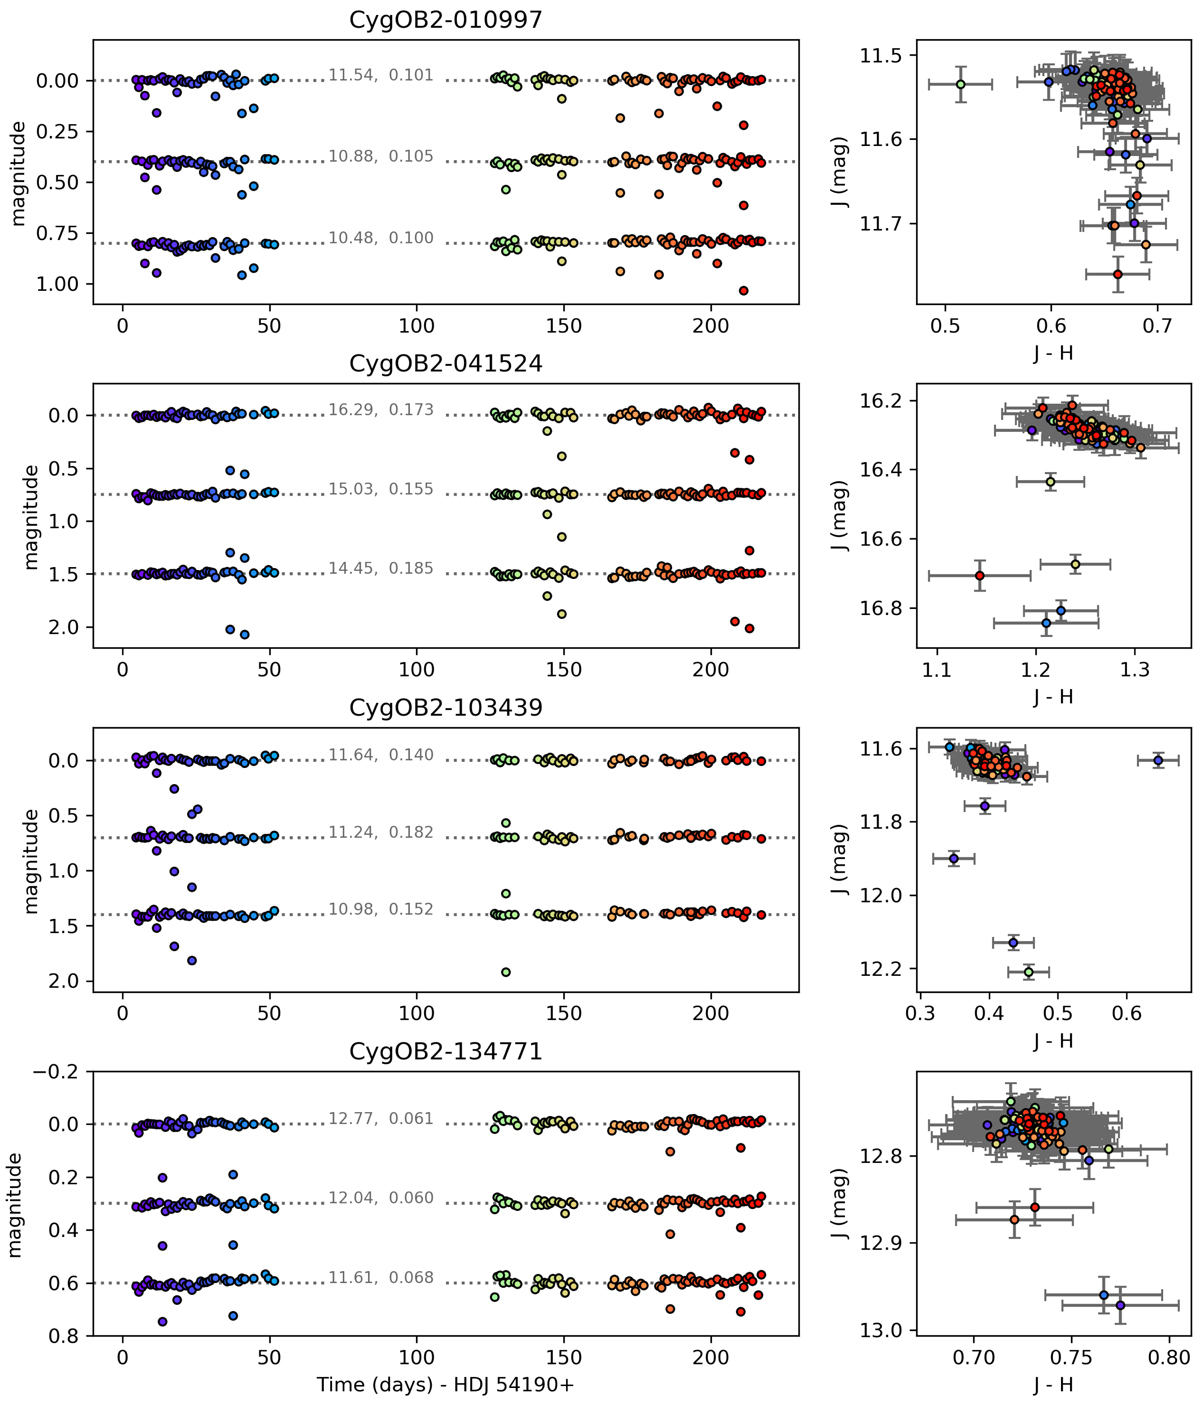
Four eclipsing binary candidates that were not periodic in our study. Left: J, H, and K light curves for each star. The median magnitude and ptp amplitude are written in the plot. Right: J vs. J − H CMDs. In both left and right plots, colors reflect the date of the observation as in Fig. 4.
Current usage metrics show cumulative count of Article Views (full-text article views including HTML views, PDF and ePub downloads, according to the available data) and Abstracts Views on Vision4Press platform.
Data correspond to usage on the plateform after 2015. The current usage metrics is available 48-96 hours after online publication and is updated daily on week days.
Initial download of the metrics may take a while.