Fig. 14.
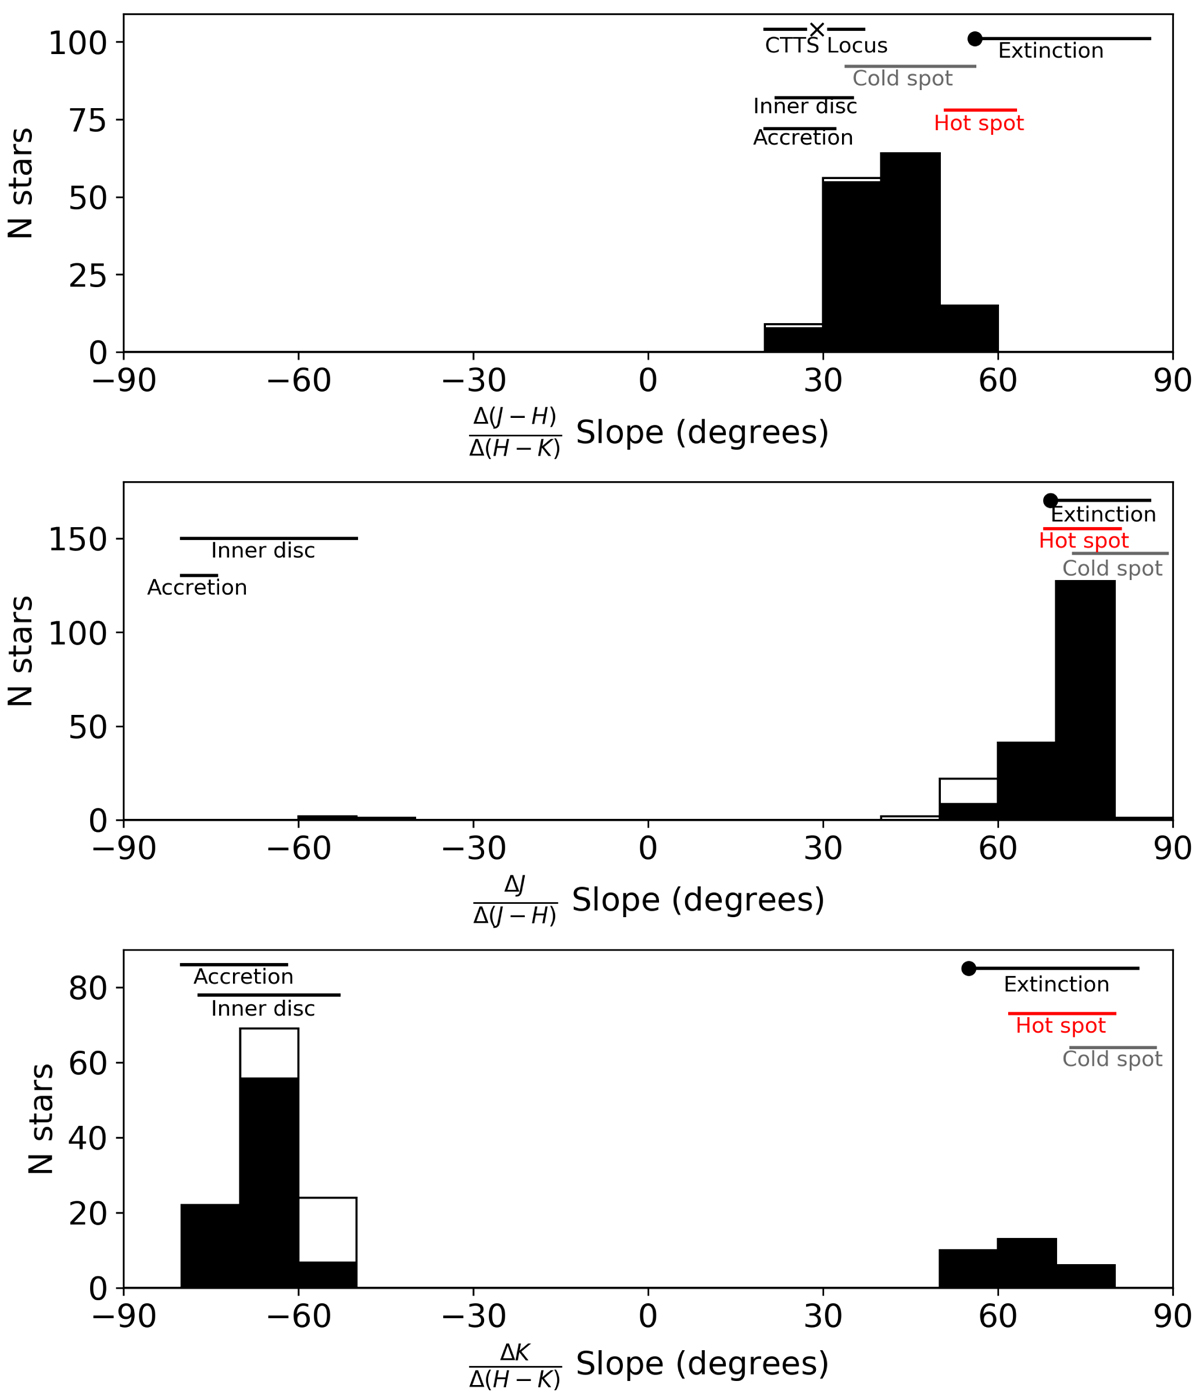
Distribution of slopes measured in the color-color and color-magnitude diagrams. The figure shows slopes for J − H vs. H − K (top), J vs. J − H (middle), and K vs. H − K (bottom) diagrams. We plotted the expected slopes for each physical mechanism as line segments, following the ranges in Table 7. The X mark shows the exact position of the T Tauri Locus. The black circle shows the slope expected for the typical dust opacity index in the ISM. Black bars show the stars in S1 sample and with precision in the light curve better than 5%, empty bars show stars in the S2 sample or with precision worse than 5%.
Current usage metrics show cumulative count of Article Views (full-text article views including HTML views, PDF and ePub downloads, according to the available data) and Abstracts Views on Vision4Press platform.
Data correspond to usage on the plateform after 2015. The current usage metrics is available 48-96 hours after online publication and is updated daily on week days.
Initial download of the metrics may take a while.