Fig. 10.
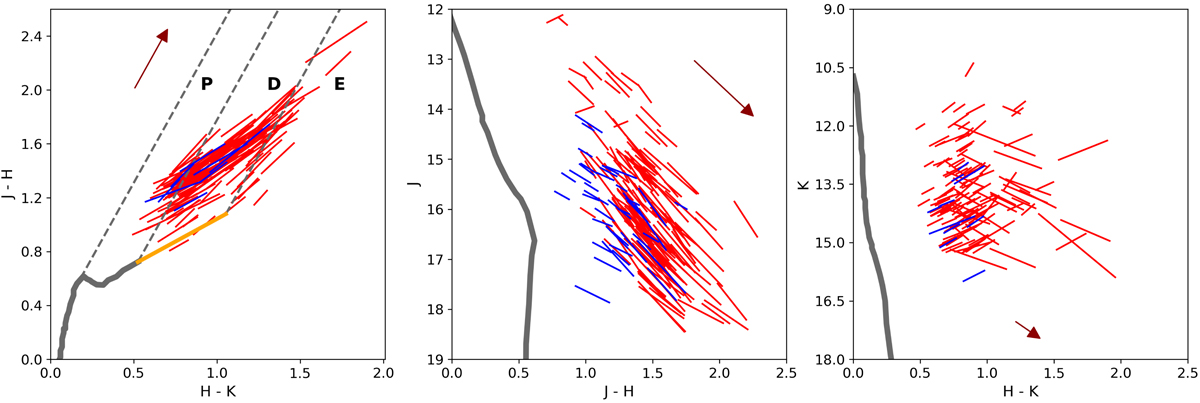
Color-magnitude and color-color diagrams with the slopes for the stars presenting a linear variation. Red lines show disk-bearing stars, and blue lines show stars without discs. The length of each line segment reflects the amplitude of the variability. The dark red arrows show the median interstellar extinction toward CygOB2, and the gray lines show as reference of unreddened normal photosphere colors, an empiric isochrone from Kraus & Hillenbrand (2007).
Current usage metrics show cumulative count of Article Views (full-text article views including HTML views, PDF and ePub downloads, according to the available data) and Abstracts Views on Vision4Press platform.
Data correspond to usage on the plateform after 2015. The current usage metrics is available 48-96 hours after online publication and is updated daily on week days.
Initial download of the metrics may take a while.