Fig. 1.
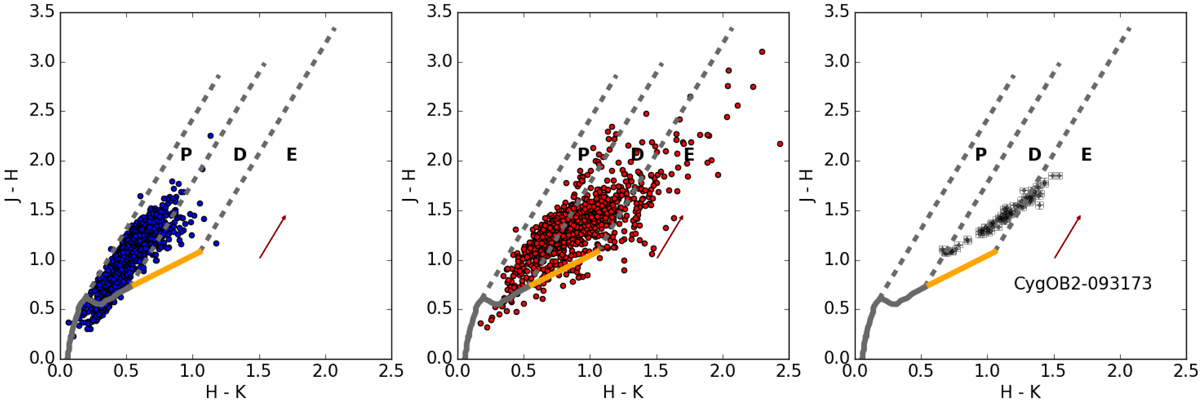
Near-IR (JHK) color-color diagrams. Left and middle panels: median colors of the 3811 diskless stars (blue dots) and the 1272 disk-bearing stars (red dots) analyzed in the present study. Right panel: CygOB2-093173 variable star. Black dots show the color of the star in each observed night. The regions labeled as “P”, “D”, and “E” are the regions typically occupied by stars with normal photospheric colors, disk-bearing colors, and extreme near-IR excess respectively. The dark red arrow shows the effect of the interstellar reddening for the median visual extinction expected for stars in the CygOB2 association (AV = 4.1m). The gray solid curve shows an empirical dwarf sequence by Kraus & Hillenbrand (2007) and the orange line shows the Meyer et al. (1997) T Tauri locus. Dashed gray lines show extinction paths of AV = 10m for 0.6 M⊙ and 0.08 M⊙ stars, and the truncation point of the T Tauri locus.
Current usage metrics show cumulative count of Article Views (full-text article views including HTML views, PDF and ePub downloads, according to the available data) and Abstracts Views on Vision4Press platform.
Data correspond to usage on the plateform after 2015. The current usage metrics is available 48-96 hours after online publication and is updated daily on week days.
Initial download of the metrics may take a while.