Fig. 5.
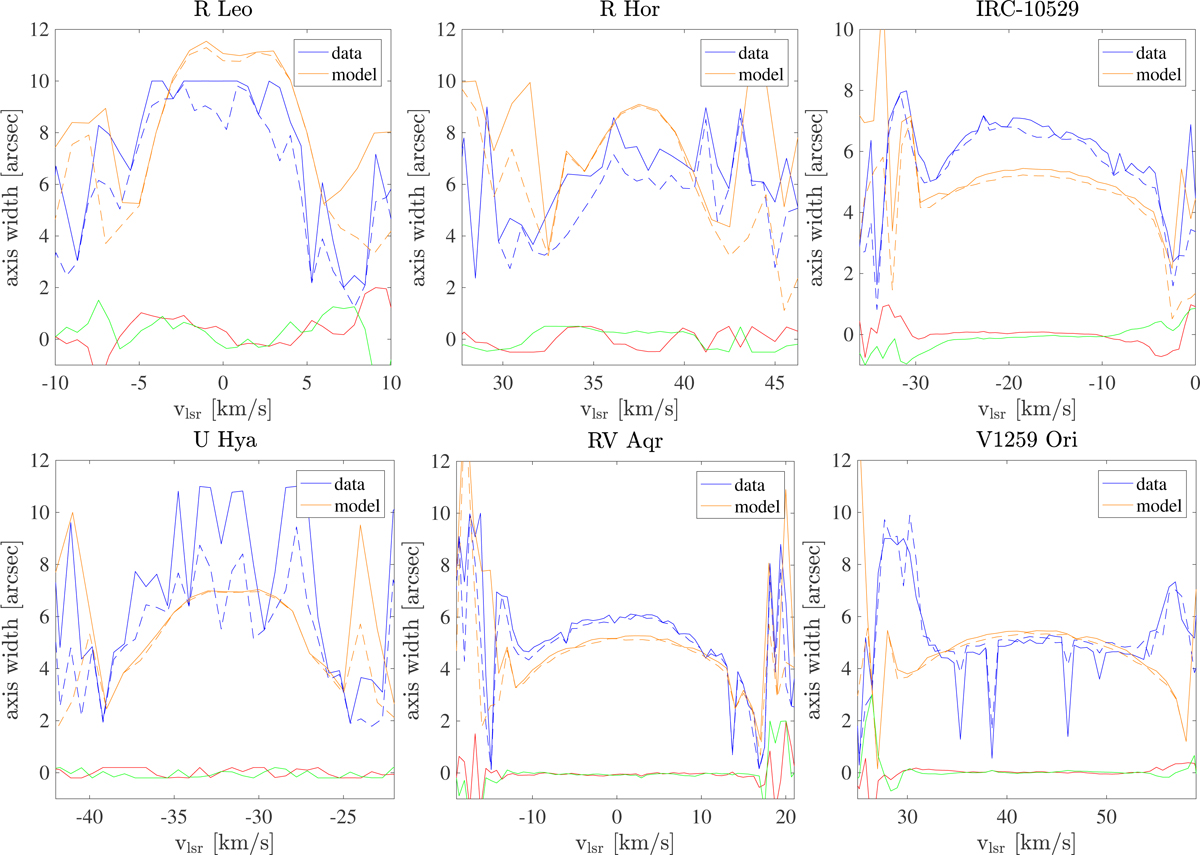
Comparison between the results from fitting a Gaussian emission distribution to the CO(2−1) data (blue) and the model results (orange) based on previous best-fit models (see text). The solid lines show the major axis and the dashed lines show the minor axis. The red and green lines show the RA and Dec. offsets for the data, respectively. Top row: three M-type stars, and bottom row: three C-type stars, with an increasing mass-loss rate (Table 1). The results are affected by the difficulties of fitting a Gaussian distribution to the weaker and smaller emission distribution close to the edge of the line. For error bars on the results from the measurements, see Figs. E.1–E.2.
Current usage metrics show cumulative count of Article Views (full-text article views including HTML views, PDF and ePub downloads, according to the available data) and Abstracts Views on Vision4Press platform.
Data correspond to usage on the plateform after 2015. The current usage metrics is available 48-96 hours after online publication and is updated daily on week days.
Initial download of the metrics may take a while.