Fig. 3.
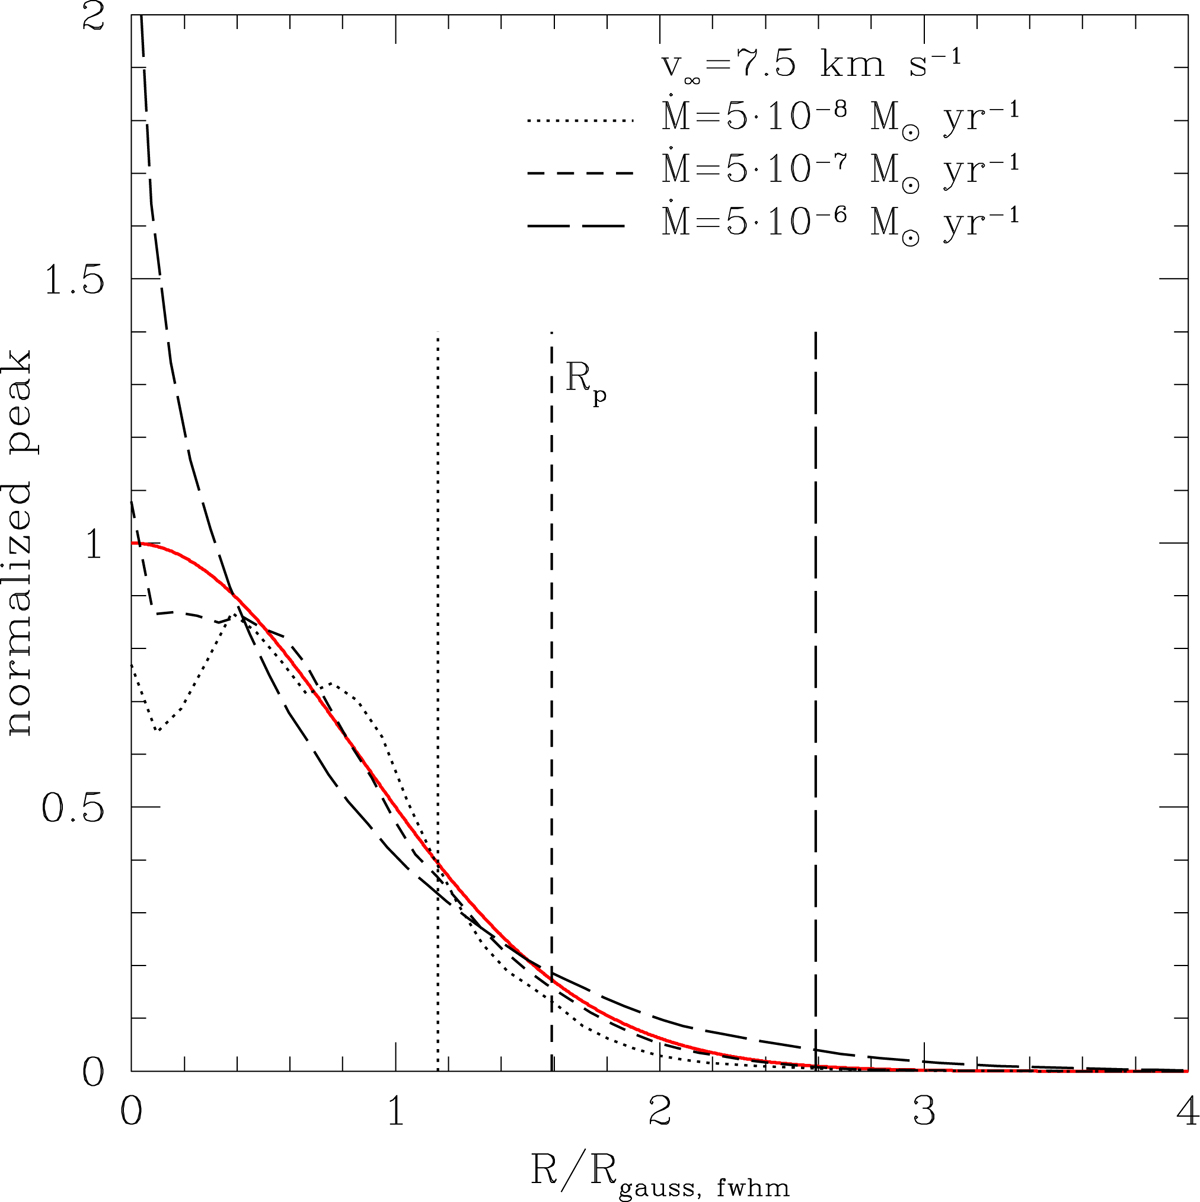
CO(2−1) intensity distribution at the systemic velocity as a function of radius for three M-star models from Saberi et al. (2019). The models were normalized to the peak of the fitted Gaussian and scaled to the FWHM radius of that Gaussian for each model separately. The normalized Gaussian is indicated by the solid red line in the figure. For each model, the vertical lines indicate the photodissociation radius Rp, which was also scaled to the Gaussian FWHM radius for each model. See text for a further explanation.
Current usage metrics show cumulative count of Article Views (full-text article views including HTML views, PDF and ePub downloads, according to the available data) and Abstracts Views on Vision4Press platform.
Data correspond to usage on the plateform after 2015. The current usage metrics is available 48-96 hours after online publication and is updated daily on week days.
Initial download of the metrics may take a while.