Fig. 2.
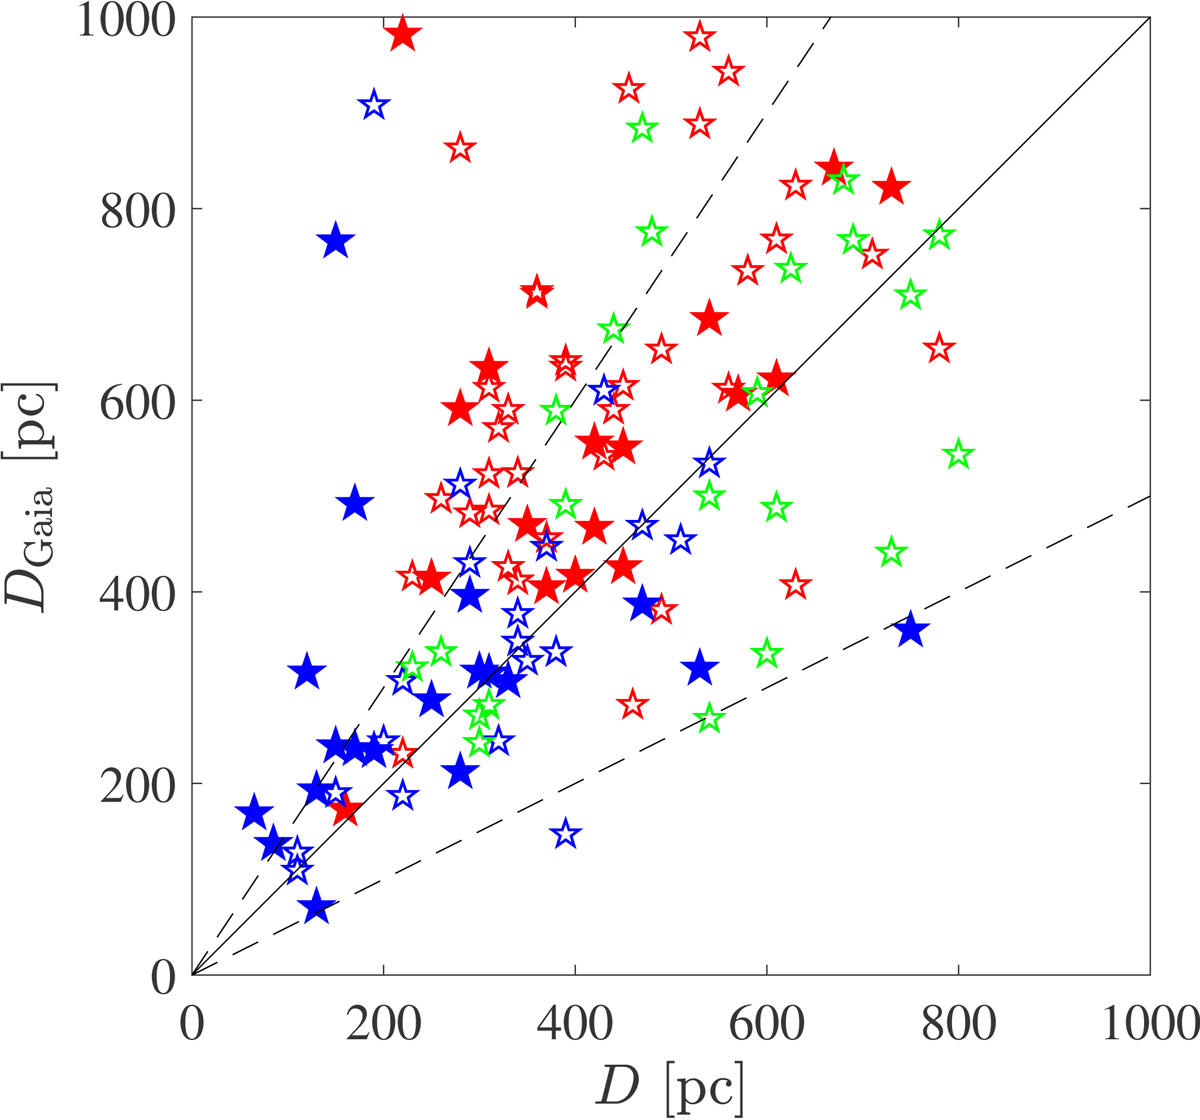
Comparison between distances from Gaia DR2 parallaxes and the adopted distances from the previous analysis (see text for details) for the full ∼180 star DEATHSTAR sample. Red symbols are carbon stars, blue symbols are M-type stars, and green symbols are S-type stars. Filled symbols are the sources included in this paper. The solid, black line marks a one-to-one correlation, while the dashed lines show the range of ±50%.
Current usage metrics show cumulative count of Article Views (full-text article views including HTML views, PDF and ePub downloads, according to the available data) and Abstracts Views on Vision4Press platform.
Data correspond to usage on the plateform after 2015. The current usage metrics is available 48-96 hours after online publication and is updated daily on week days.
Initial download of the metrics may take a while.