Fig. 1.
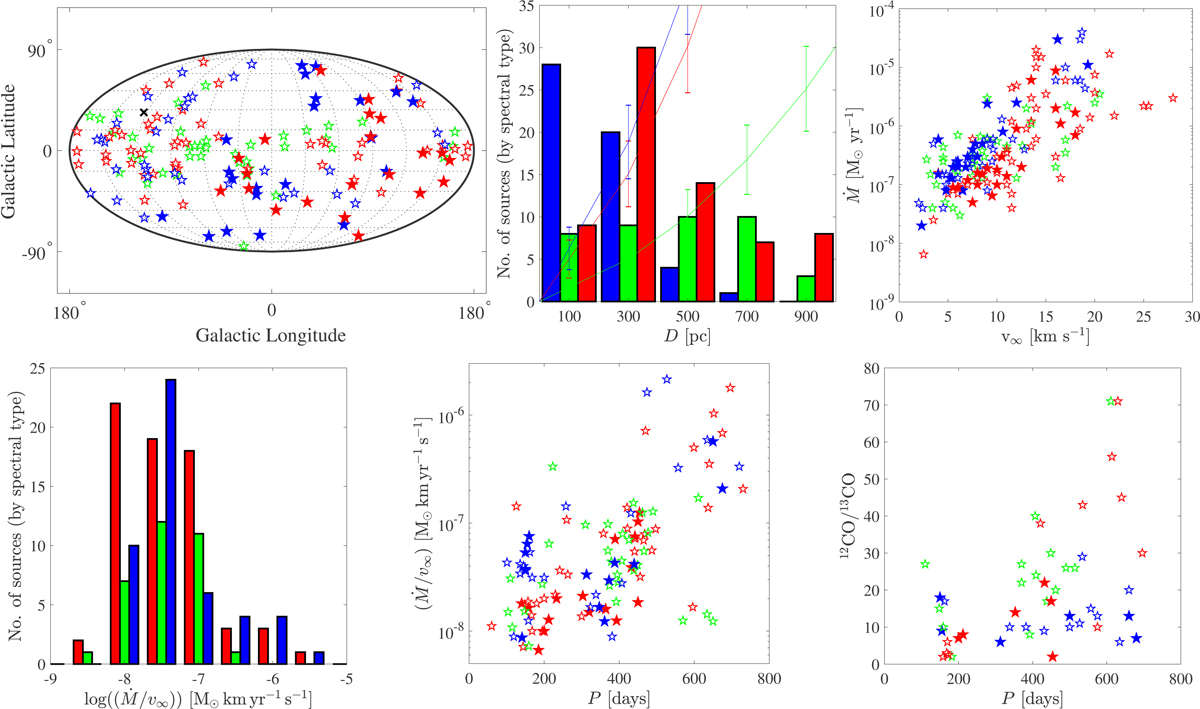
Sample statistics of the full ∼180 star DEATHSTAR sample. M-type stars are blue, C-type stars are red, and S-type stars are green. Filled symbols mark the stars included in this paper. Upper left: galactic distribution of the full sample. Upper middle: distance, D, distribution. These are preliminary distances from previous publications (see text and Table 1). The solid lines show the expected distributions for each spectral type with Poisson errors (Jura 1990; Jura & Kleinmann 1992; Jura et al. 1993). Upper right: wind properties (mass-loss rate, Ṁ, and terminal expansion velocity, v∞) from previous publications. See text for references. Lower left: Ṁ/v∞ distribution for the full sample. We note that Ṁ/v∞ is a proxy for the wind density. Lower middle: Ṁ/v∞ as a function of the pulsational period. Lower left: 12CO/13CO ratio for the sample sources (Ramstedt & Olofsson 2014) is plotted against the pulsational period. Both parameters are expected to increase as the stars evolve. See text for a further discussion.
Current usage metrics show cumulative count of Article Views (full-text article views including HTML views, PDF and ePub downloads, according to the available data) and Abstracts Views on Vision4Press platform.
Data correspond to usage on the plateform after 2015. The current usage metrics is available 48-96 hours after online publication and is updated daily on week days.
Initial download of the metrics may take a while.