Fig. A.1.
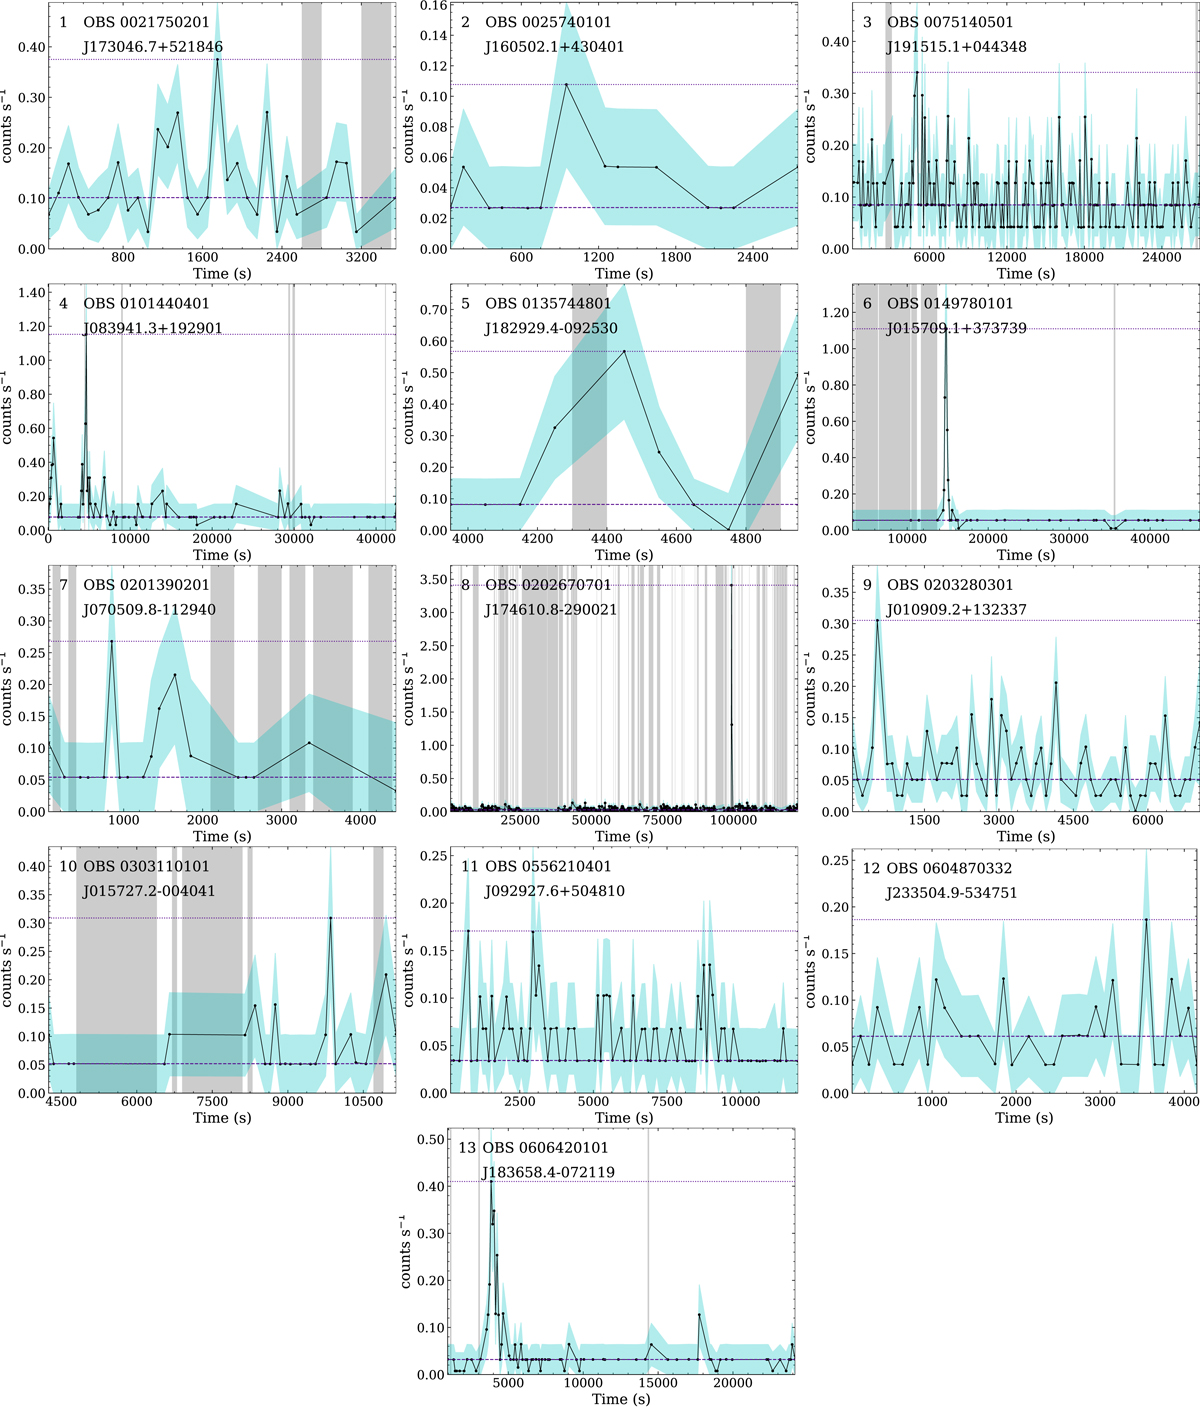
Light curves of sources detected with EXOD, present in 3XMM-DR8, but not classified as variable by the automatic pipeline. The light curves are plotted in black with cyan shaded regions representing the 1σ error bars. The dashed purple line represents ![]() , the median number of counts. The dotted purple line represents 𝒞max, the maximal number of counts. The gray vertical shaded regions represent the bad time intervals. Each plot gives the source ID, the OBSID in which it was detected and the 3XMM name of the source.
, the median number of counts. The dotted purple line represents 𝒞max, the maximal number of counts. The gray vertical shaded regions represent the bad time intervals. Each plot gives the source ID, the OBSID in which it was detected and the 3XMM name of the source.
Current usage metrics show cumulative count of Article Views (full-text article views including HTML views, PDF and ePub downloads, according to the available data) and Abstracts Views on Vision4Press platform.
Data correspond to usage on the plateform after 2015. The current usage metrics is available 48-96 hours after online publication and is updated daily on week days.
Initial download of the metrics may take a while.