Fig. 6.
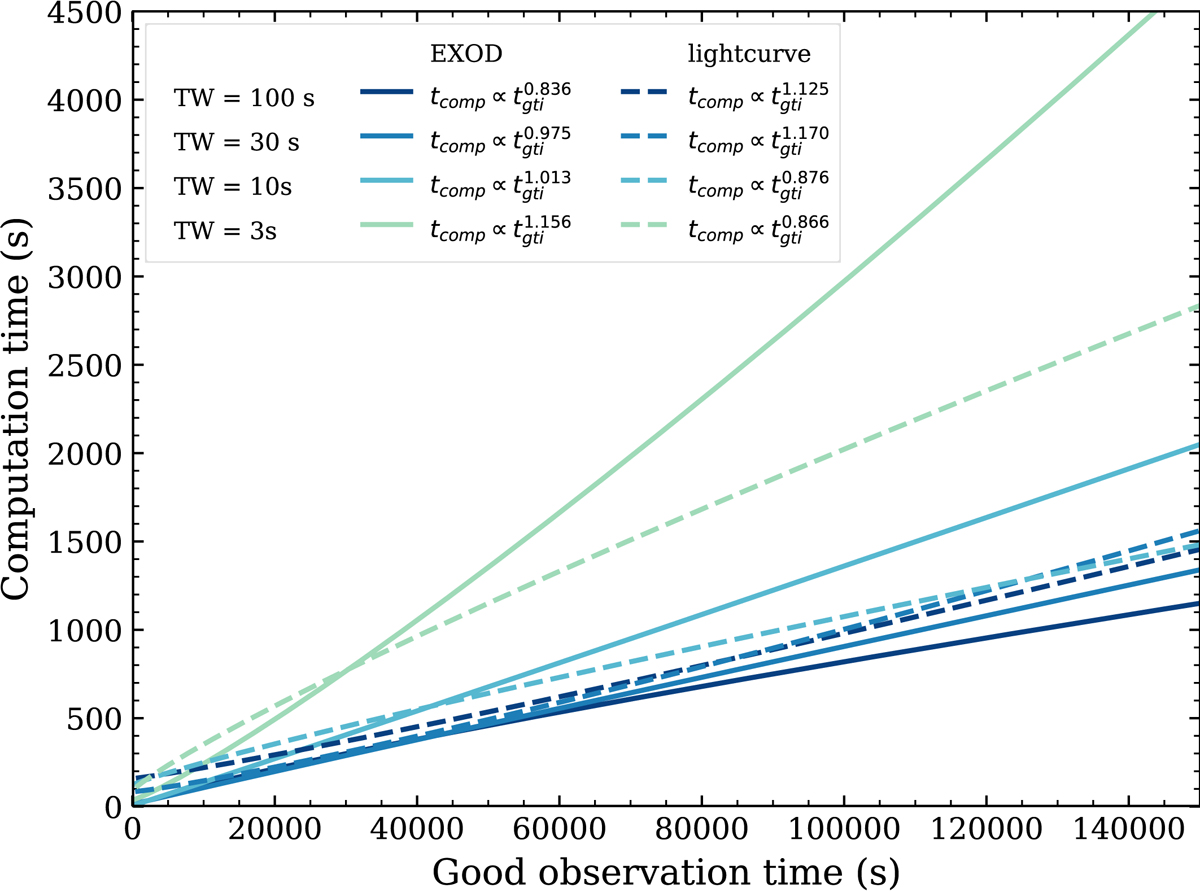
Computation time as a function of the observation time that has not been polluted by background flares (good time) fitted to a power law. The solid lines indicate the EXOD detector computation time. The dashed lines indicate the light curve computation time for one source. Blue (dark) is the computation time for a time window of 100 s, green (medium) for 30 s, orange (medium) for 10 s and pink (light) for 3s.
Current usage metrics show cumulative count of Article Views (full-text article views including HTML views, PDF and ePub downloads, according to the available data) and Abstracts Views on Vision4Press platform.
Data correspond to usage on the plateform after 2015. The current usage metrics is available 48-96 hours after online publication and is updated daily on week days.
Initial download of the metrics may take a while.