Fig. 3.
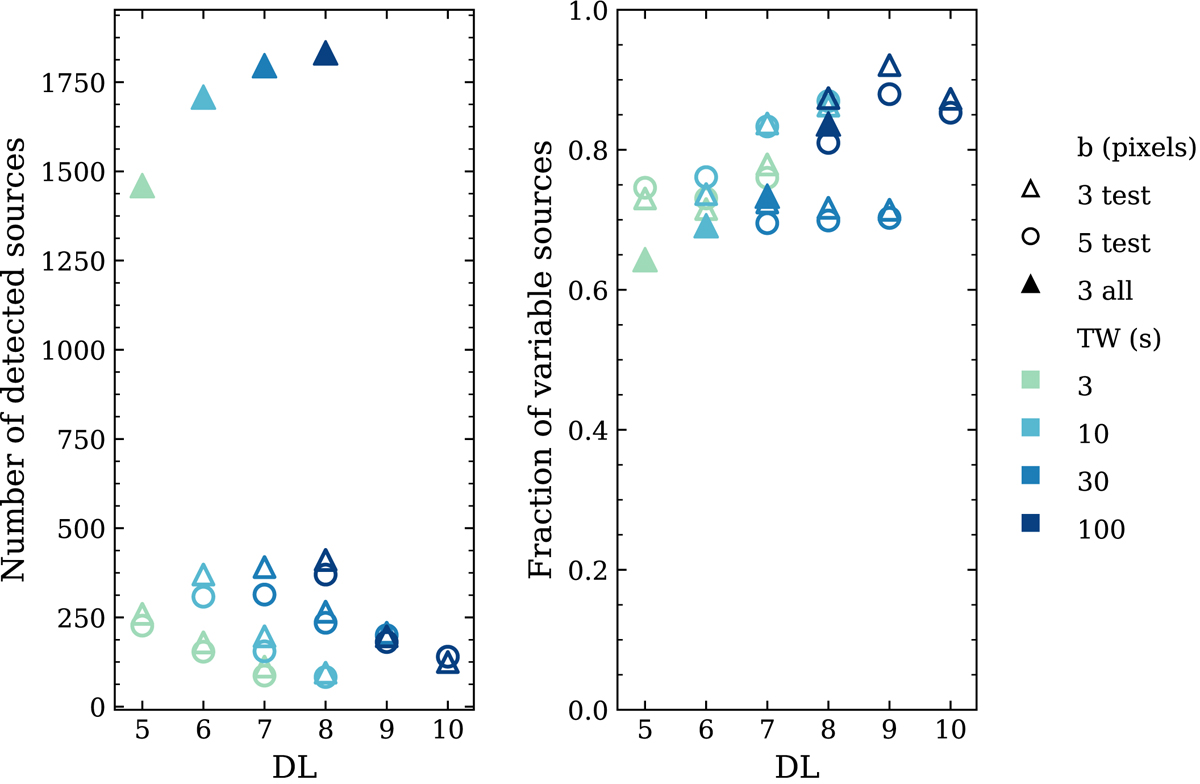
Properties of the sources detected by EXOD. Test observations with the detection parameters listed in Table 2: empty markers. All observations with the parameters in Table 3: filled markers. Left: number of detected sources as a function of DL. Right: fraction of sources confirmed to be variable through the χ2 and KS tests among the detected ones as a function of DL. The colors correspond to different TW: light green for TW = 3 s, light blue for TW = 10 s, medium blue for TW = 30 s and dark blue for TW = 100 s. The shapes represent the box size: triangles for b = 3 × 3 pixels and circles for b = 5 × 5 pixels.
Current usage metrics show cumulative count of Article Views (full-text article views including HTML views, PDF and ePub downloads, according to the available data) and Abstracts Views on Vision4Press platform.
Data correspond to usage on the plateform after 2015. The current usage metrics is available 48-96 hours after online publication and is updated daily on week days.
Initial download of the metrics may take a while.