Fig. 1.
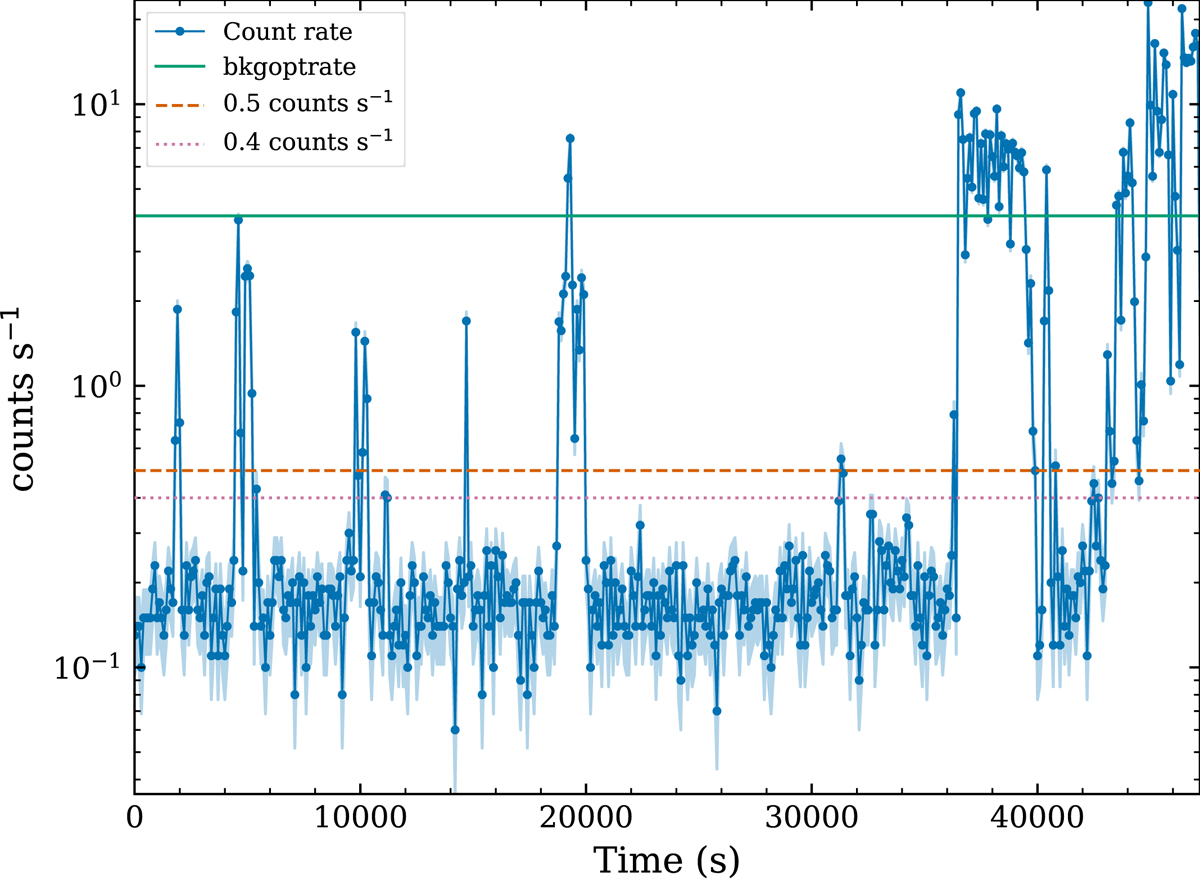
Count rate of observation 0112370801 between 10 – 12 keV as a function of time since the beginning of the observation. The vertical axis is in logarithmic scale and we use a time binning of 100 s. Green solid line: optimal rate as computed by bkgoptrate, in this case ∼4 cts s−1. Orange dashed line: 0.5 cts s−1. Pink dotted line: 0.4 cts s−1.
Current usage metrics show cumulative count of Article Views (full-text article views including HTML views, PDF and ePub downloads, according to the available data) and Abstracts Views on Vision4Press platform.
Data correspond to usage on the plateform after 2015. The current usage metrics is available 48-96 hours after online publication and is updated daily on week days.
Initial download of the metrics may take a while.