Fig. 1.
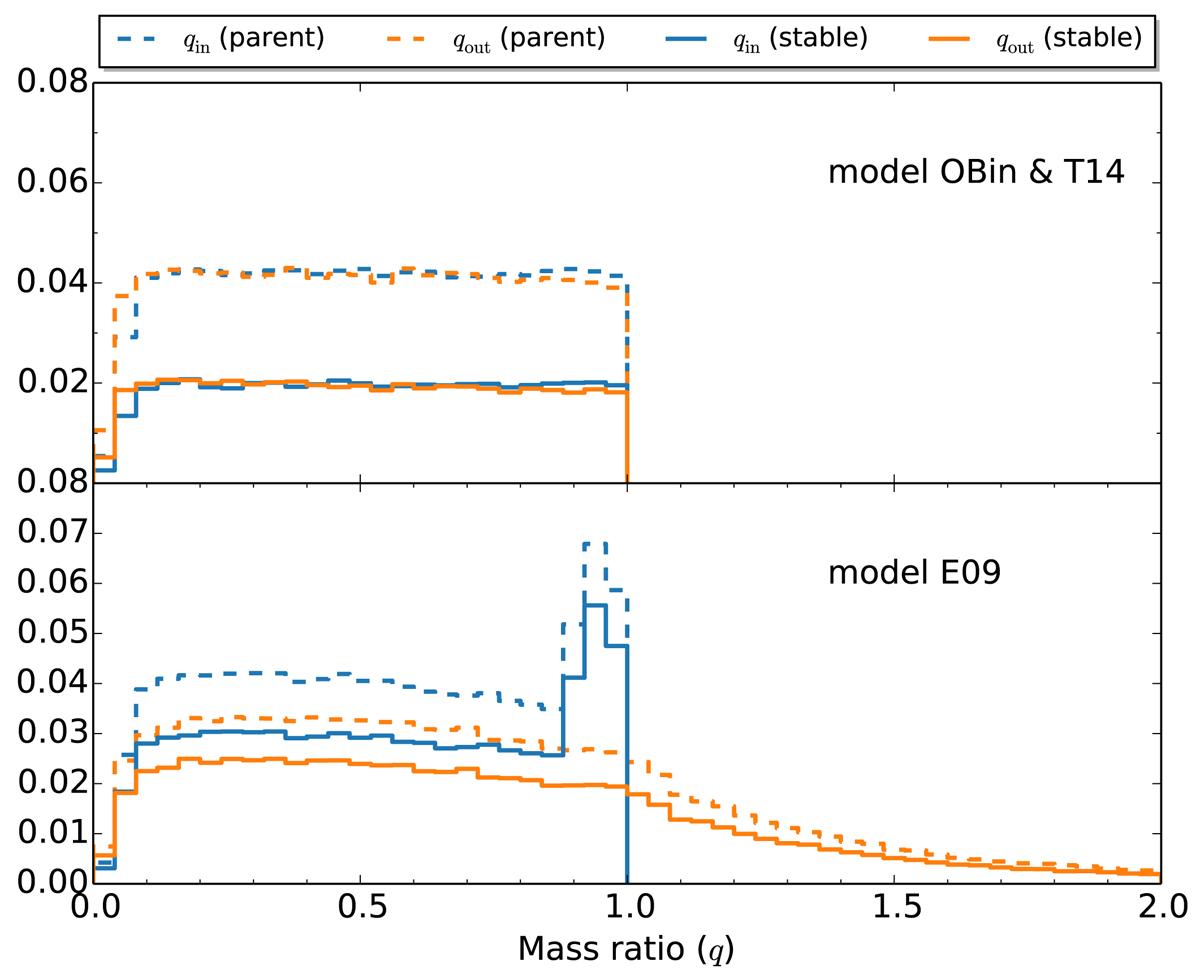
Binned distributions of initial mass ratios for the inner and outer orbit (blue and orange lines). The dashed lines (normalised to unity) reflect the parent distributions from which we draw the mass ratios. The solid lines show the subset of systems that are dynamically stable according to the criterion by Mardling et al. (1999) and that are used in the simulations. On the top, a flat mass ratio distribution is shown as used in model OBin and T14, whereas on the bottom the mass ratio distribution from model E09 is shown.
Current usage metrics show cumulative count of Article Views (full-text article views including HTML views, PDF and ePub downloads, according to the available data) and Abstracts Views on Vision4Press platform.
Data correspond to usage on the plateform after 2015. The current usage metrics is available 48-96 hours after online publication and is updated daily on week days.
Initial download of the metrics may take a while.