Free Access
Fig. 7.
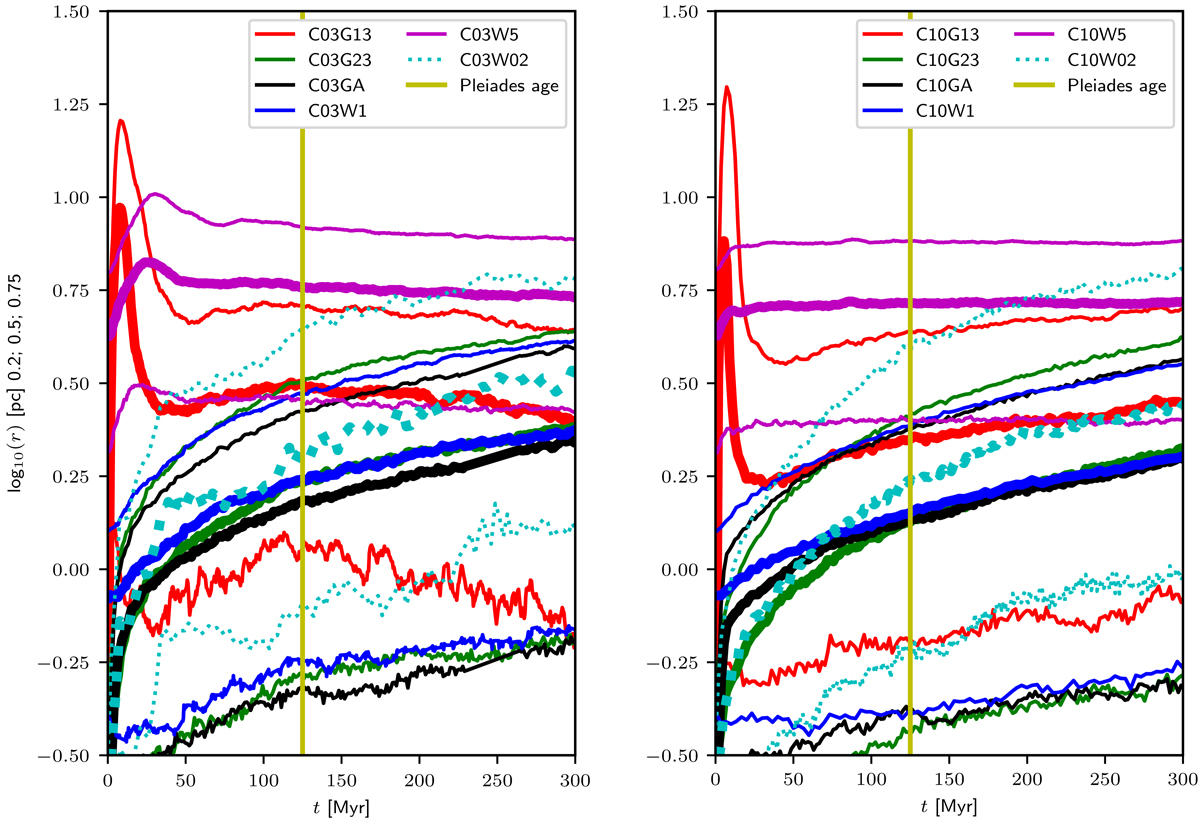
Evolution of the 0.2, 0.5 (thick line), and 0.75 Lagrangian radius of the star cluster models. Shown are the lower (Mcl(0) = 1400 M⊙) and higher mass (Mcl(0) = 4400 M⊙) clusters, (left and right panels, respectively). The age of the Pleiades is indicated by the vertical yellow line.
Current usage metrics show cumulative count of Article Views (full-text article views including HTML views, PDF and ePub downloads, according to the available data) and Abstracts Views on Vision4Press platform.
Data correspond to usage on the plateform after 2015. The current usage metrics is available 48-96 hours after online publication and is updated daily on week days.
Initial download of the metrics may take a while.