Fig. 14.
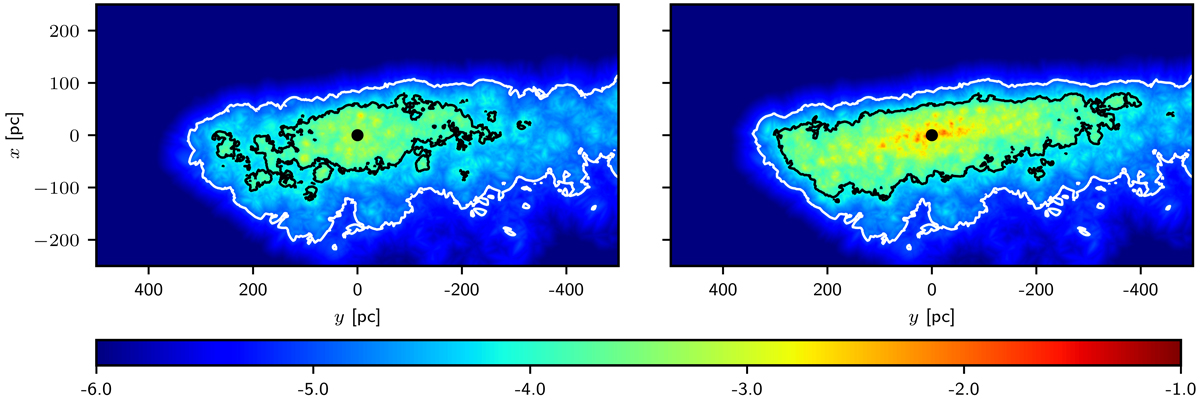
Stellar surface density for the star-forming molecular cloud and the most massive star cluster it formed for a cluster assuming SFE = 100% (left panel), and SFE = 33% (right panel) at the age of 125 Myr. We plot only the stars whose velocities differ less than by 3 km s−1 from the star cluster. In the vicinity of the cluster (r ≲ 100 pc), which is represented by the black dot, the stars formed within a cloud are almost uniformly distributed while the stars released in the tidal tail are elongated approximately along the y-axis. The colourscale and contours have the same meaning as in Fig. 1.
Current usage metrics show cumulative count of Article Views (full-text article views including HTML views, PDF and ePub downloads, according to the available data) and Abstracts Views on Vision4Press platform.
Data correspond to usage on the plateform after 2015. The current usage metrics is available 48-96 hours after online publication and is updated daily on week days.
Initial download of the metrics may take a while.