Fig. 11.
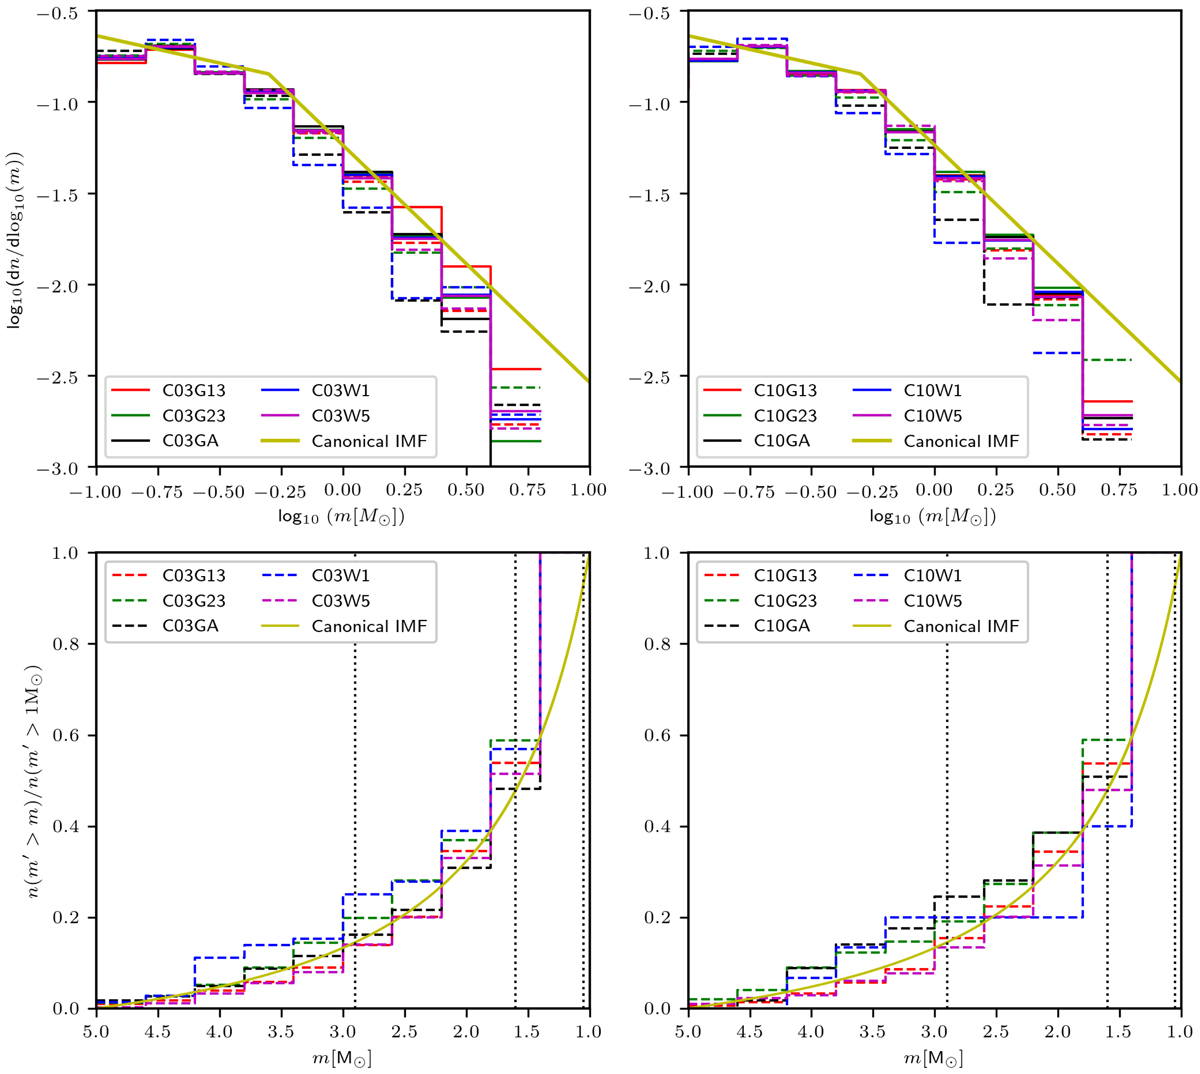
Stellar mass function at the age of the Pleiades. Left column: lower mass clusters (Mcl(0) ≈ 1400 M⊙); right column: more massive clusters (Mcl(0) ≈ 4400 M⊙). The canonical IMF (Kroupa 2001) is indicated by the yellow line. Upper row: log-log MF of all stars in the cluster (solid lines) and in the tidal tail (dashed lines). Lower row: cumulative mass function for the more massive stars (m ≳ 1 M⊙) in the tidal tail. The masses of A0, F0, and G0 star are indicated by the vertical dotted lines.
Current usage metrics show cumulative count of Article Views (full-text article views including HTML views, PDF and ePub downloads, according to the available data) and Abstracts Views on Vision4Press platform.
Data correspond to usage on the plateform after 2015. The current usage metrics is available 48-96 hours after online publication and is updated daily on week days.
Initial download of the metrics may take a while.