Fig. 10.
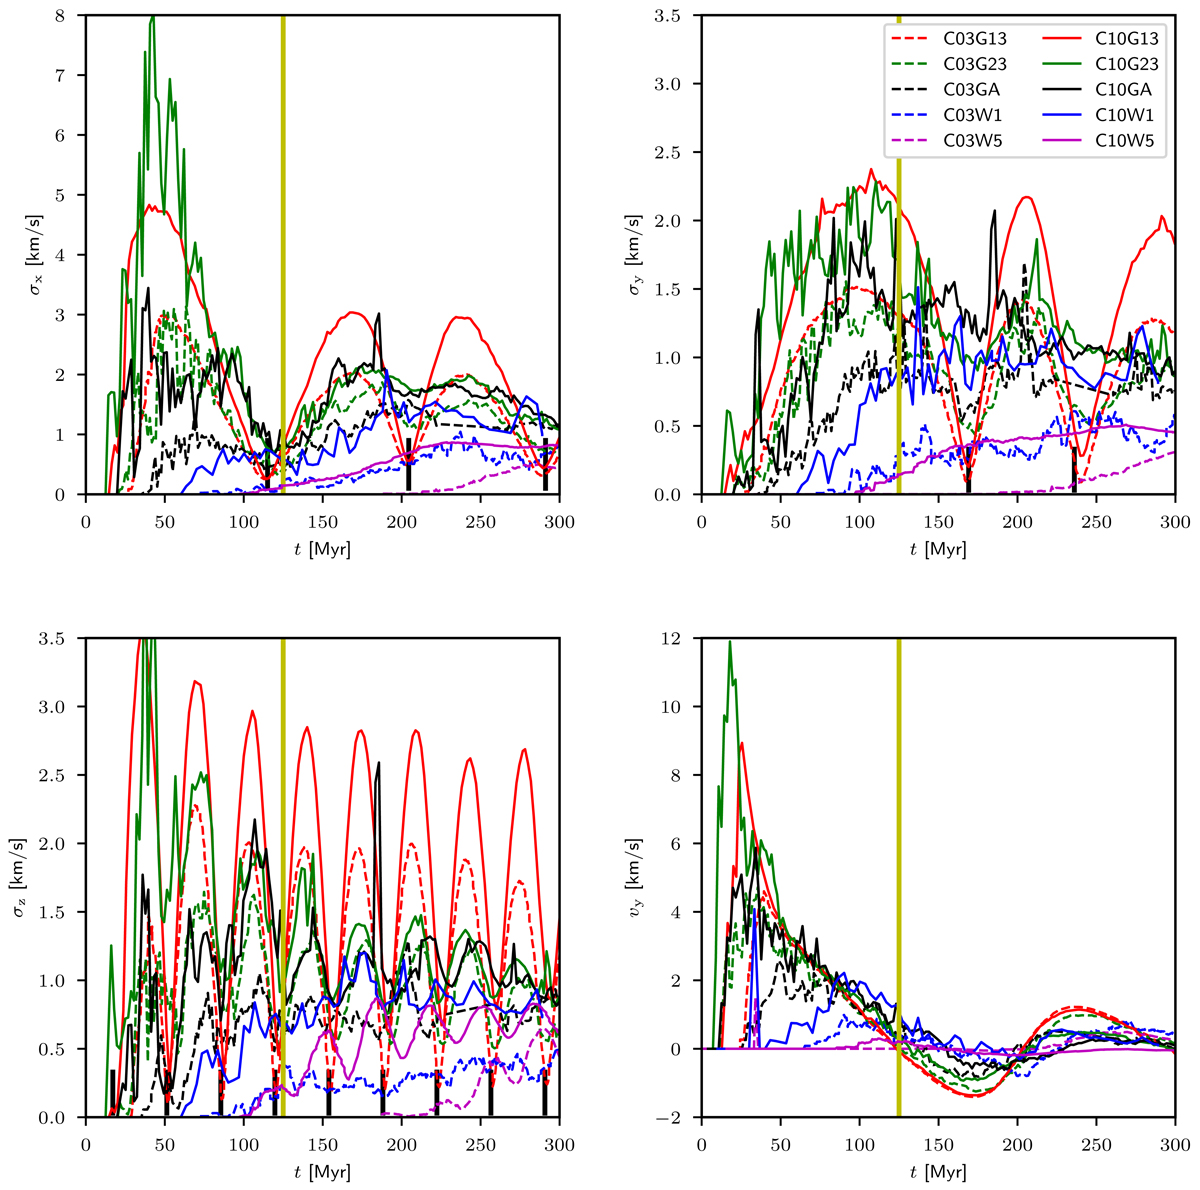
Evolution of the velocity structure of the tidal tail at 200 pc < y < 300 pc. Upper left: velocity dispersion in direction x. Upper right: velocity dispersion in direction y. Lower left: velocity dispersion in direction z. Lower right: bulk velocity in direction y. The short black vertical bars indicate the minima for the corresponding quantity according to the semi-analytic model of Paper I. The yellow vertical lines show the age of the Pleiades.
Current usage metrics show cumulative count of Article Views (full-text article views including HTML views, PDF and ePub downloads, according to the available data) and Abstracts Views on Vision4Press platform.
Data correspond to usage on the plateform after 2015. The current usage metrics is available 48-96 hours after online publication and is updated daily on week days.
Initial download of the metrics may take a while.