Fig. 1.
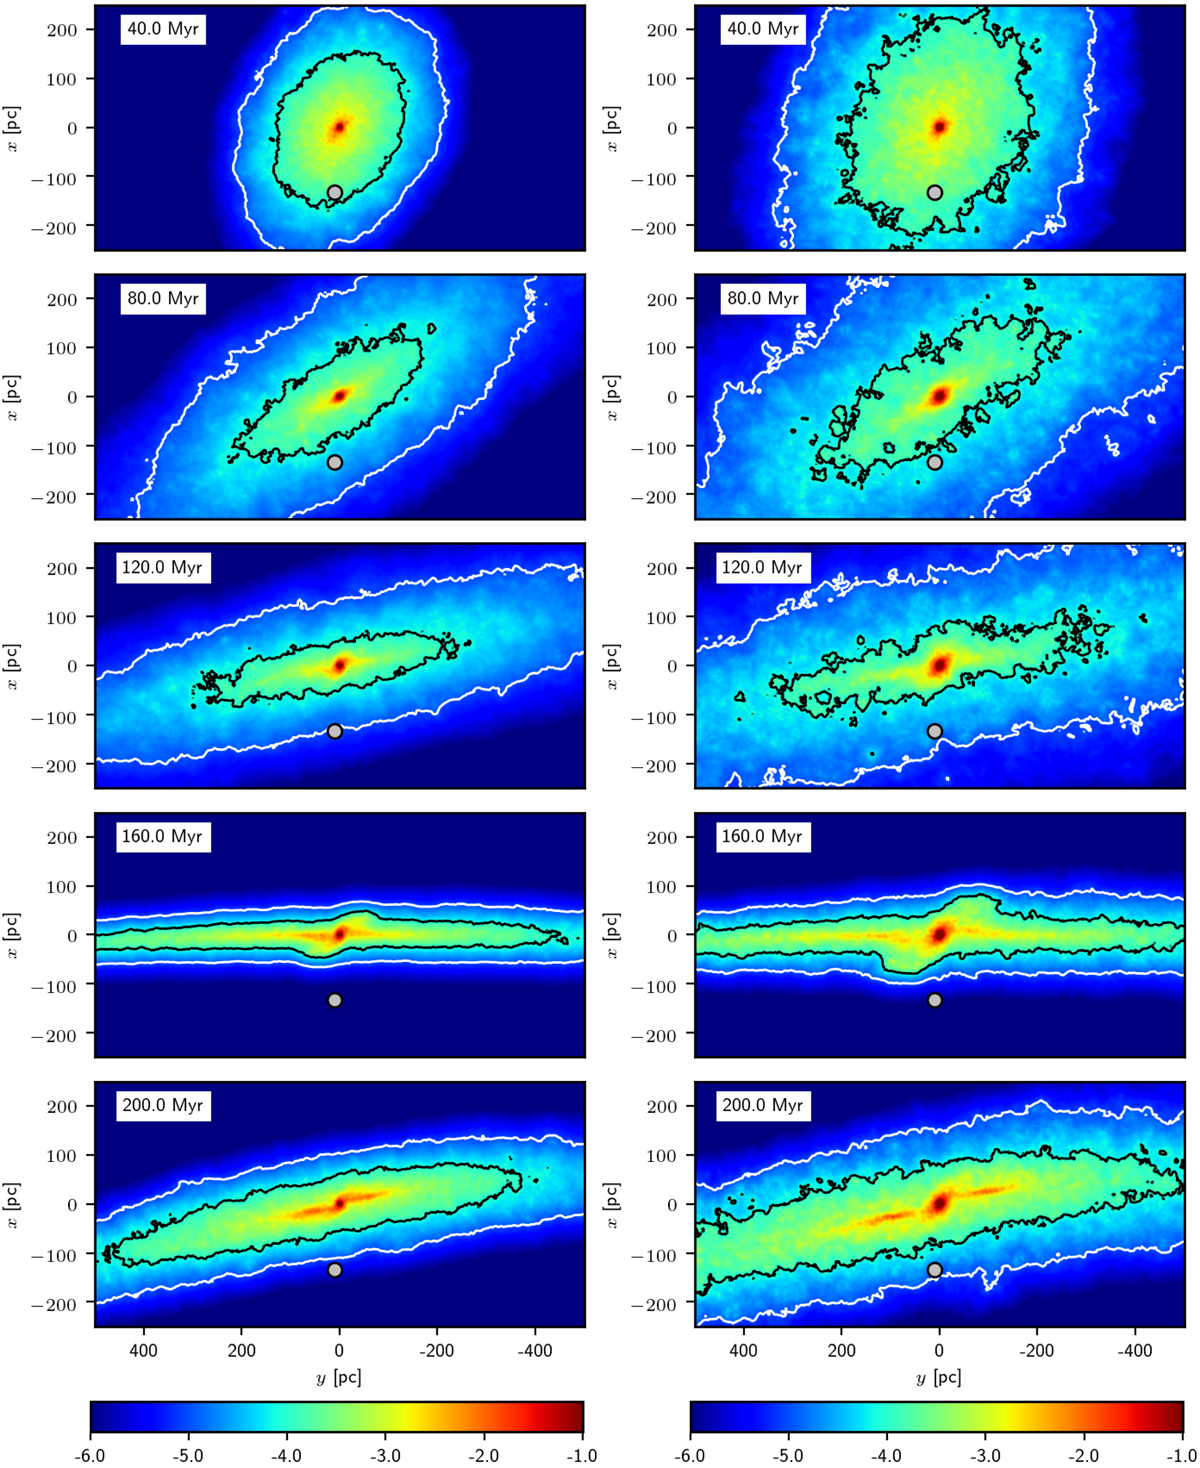
Evolution of the star number density in plane z = 0 for the models with rapid gas expulsion and SFE = 1/3 (model C03G13, left; model C10G13, right). The time is indicated in the upper left corner of each frame. The positive y-axis points in the direction of the Galactic rotation, the negative x-axis points towards the Galactic centre (the view is from the south Galactic pole). The position of the Sun is indicated by the large grey circle. The colour scheme shows the number density of stars in units log10(pc−3). Each plot is an average of between 4 (for the more massive models C10G13) and 13 (for the less massive models C03G13) simulations with a different random seed. The white contours indicate the contamination threshold for the Besançon model represented by the Schwarzschild velocity distribution (ntl = 1.0 × 10⁻⁵ pc−3) and the black contours that for the Besançon model and Hyades-Pleiades stream combined (ntl = 9.0 × 10⁻⁵ pc−3; here we take three times the value calculated in Sect. 5.2 to get an upper estimate of contamination).
Current usage metrics show cumulative count of Article Views (full-text article views including HTML views, PDF and ePub downloads, according to the available data) and Abstracts Views on Vision4Press platform.
Data correspond to usage on the plateform after 2015. The current usage metrics is available 48-96 hours after online publication and is updated daily on week days.
Initial download of the metrics may take a while.