Fig. 5.
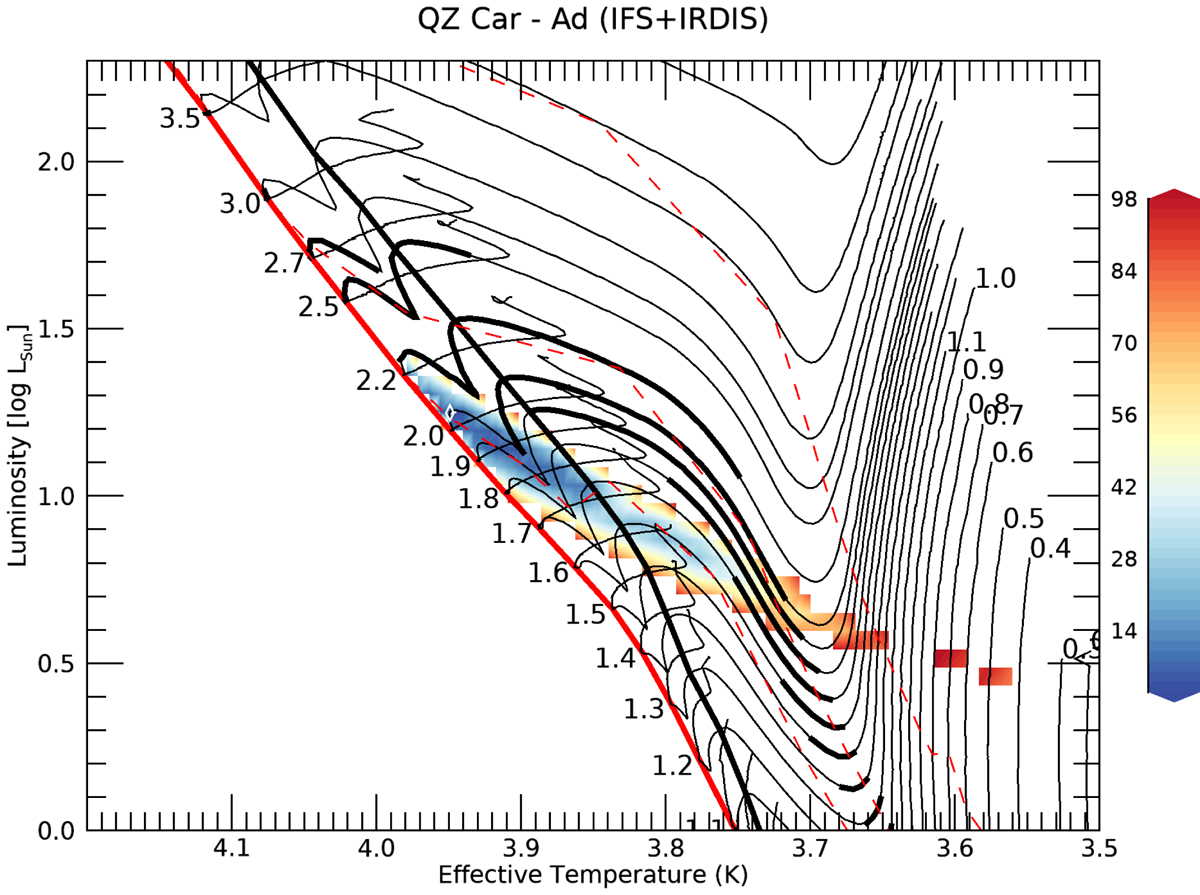
χ2-surface resulting from ATLAS model fit to Ad’s IFS+IRDIS SED projected onto the HRD plane. The thick black and red lines are ZAMS and early-MS according to Siess et al. (2000) definitions (see footnote 5). Thin black lines are the evolutionary PMS tracks for stars with masses increasing from bottom to top from 1.1 to 3.5 M⊙. The 4 to 8 Myr parts of the respective evolutionary tracks are displayed with a thicker line. Finally, the red dashed lines give, from top to bottom, the 1, 5 and 10 Myr isochrones. The best-fit model is indicated with a white diamond.
Current usage metrics show cumulative count of Article Views (full-text article views including HTML views, PDF and ePub downloads, according to the available data) and Abstracts Views on Vision4Press platform.
Data correspond to usage on the plateform after 2015. The current usage metrics is available 48-96 hours after online publication and is updated daily on week days.
Initial download of the metrics may take a while.