Fig. 4.
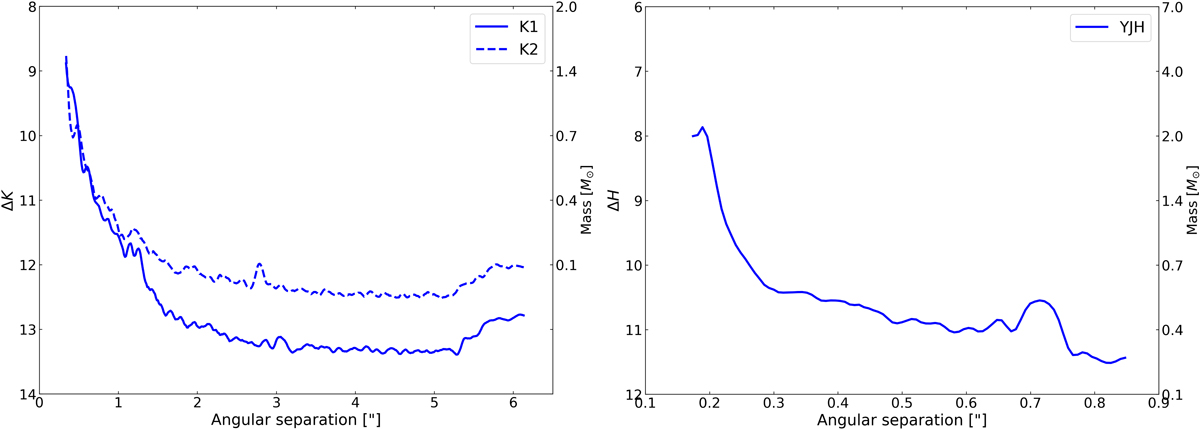
IRDIS (left) and IFS (right) detection limits (blue). The contrasts are given in the H-band for IFS and a mass scale is also provided on the right-hand axis. These masses were estimated using pre-main sequence and main-sequence tracks from Siess et al. (2000). Bumps at ![]() in the IFS contrast curves results from the trace of the deformable mirror of the instrument at this radial distance.
in the IFS contrast curves results from the trace of the deformable mirror of the instrument at this radial distance.
Current usage metrics show cumulative count of Article Views (full-text article views including HTML views, PDF and ePub downloads, according to the available data) and Abstracts Views on Vision4Press platform.
Data correspond to usage on the plateform after 2015. The current usage metrics is available 48-96 hours after online publication and is updated daily on week days.
Initial download of the metrics may take a while.