Fig. 9
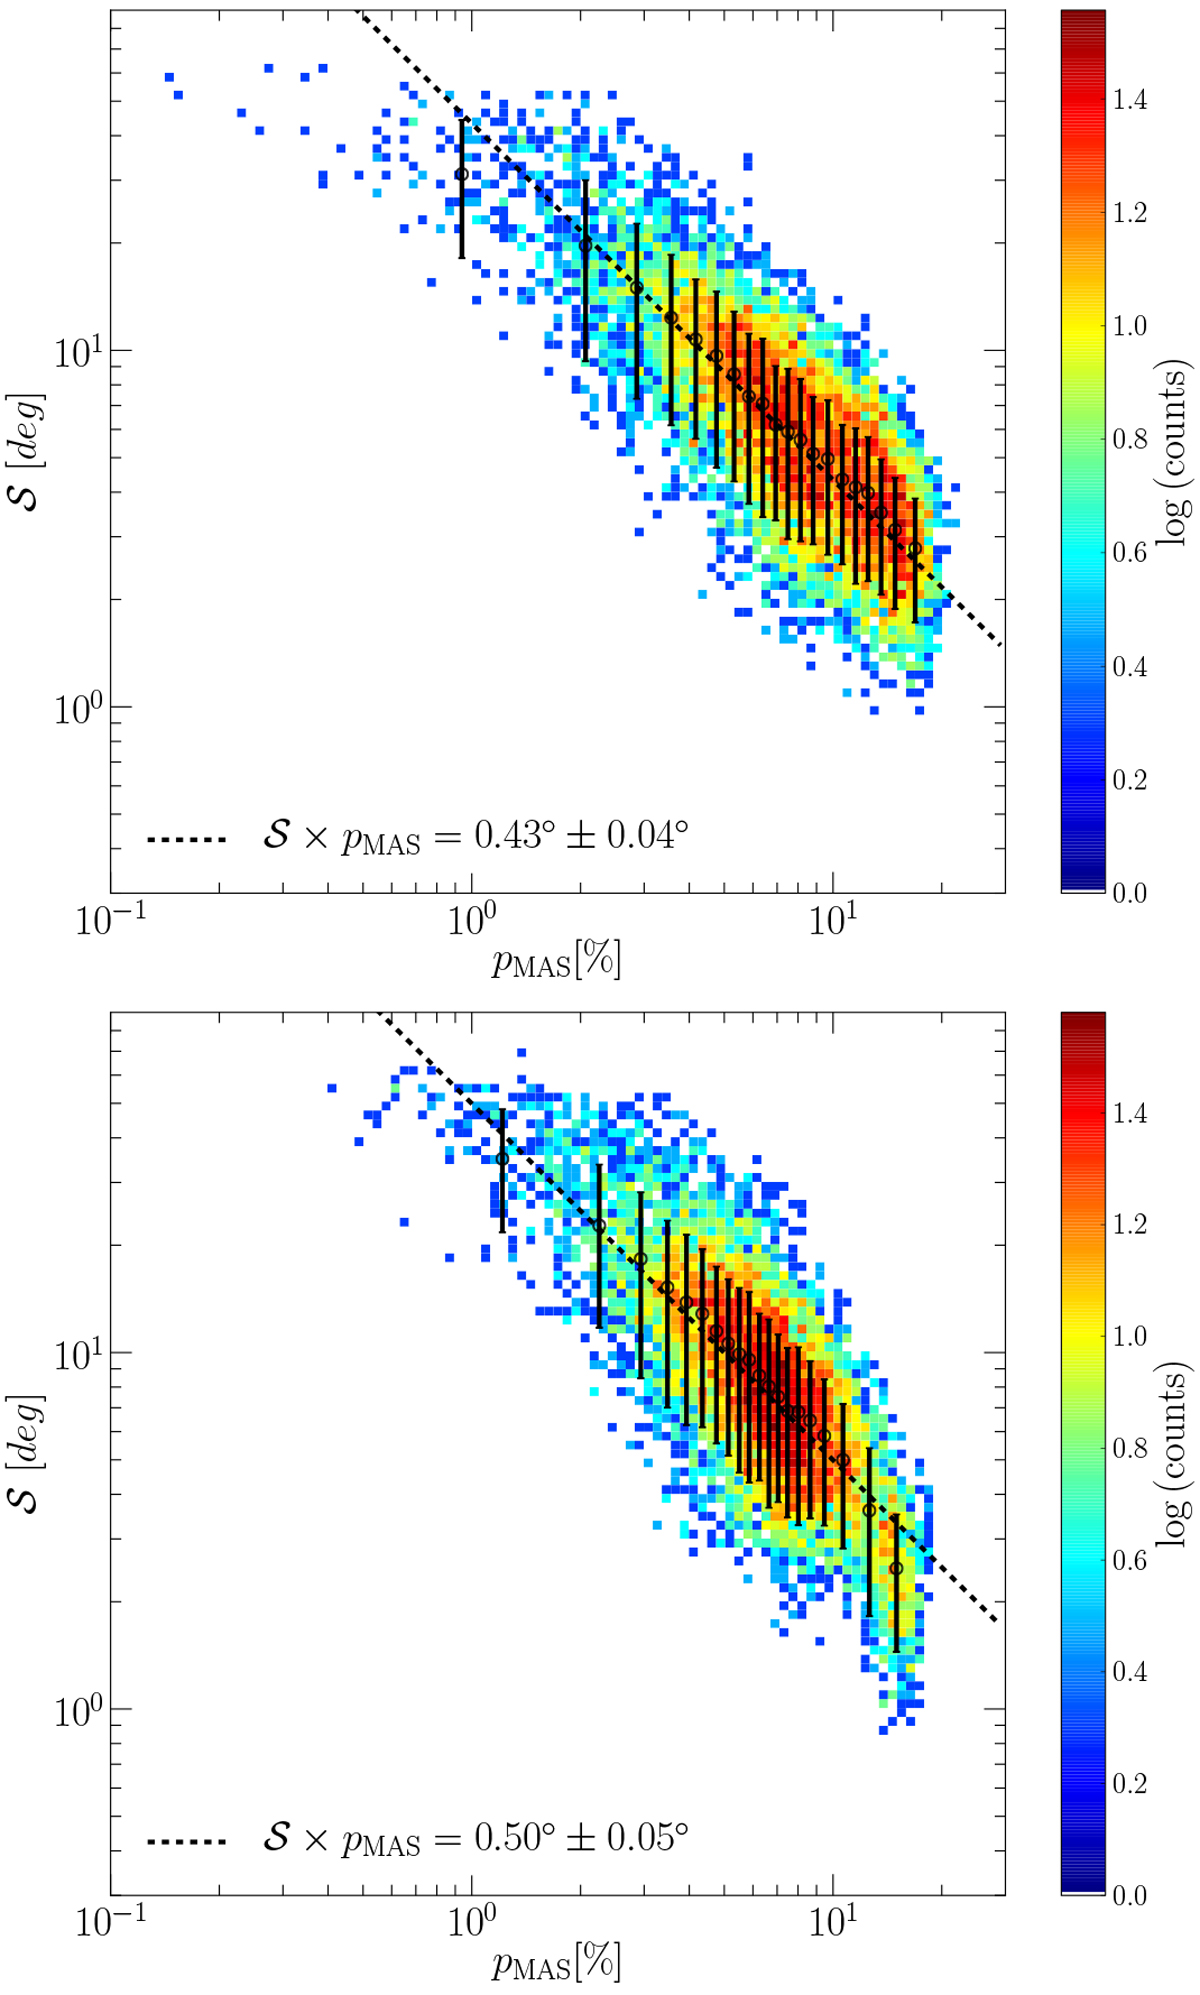
Top panel: two-dimensional histogram of the joint distribution of ![]() and pMAS over mask65 for the Planck data at a resolution of 80′ with lag δ = 40′. The black circles show the mean of
and pMAS over mask65 for the Planck data at a resolution of 80′ with lag δ = 40′. The black circles show the mean of ![]() in bins of pMAS containing the same number of map pixels. Error bars are the standard deviation of
in bins of pMAS containing the same number of map pixels. Error bars are the standard deviation of
![]() in each bin. The black dotted line is a fit of the running mean. Bottom panel: same as top panel, but for the model.
in each bin. The black dotted line is a fit of the running mean. Bottom panel: same as top panel, but for the model.
Current usage metrics show cumulative count of Article Views (full-text article views including HTML views, PDF and ePub downloads, according to the available data) and Abstracts Views on Vision4Press platform.
Data correspond to usage on the plateform after 2015. The current usage metrics is available 48-96 hours after online publication and is updated daily on week days.
Initial download of the metrics may take a while.