Fig. 7
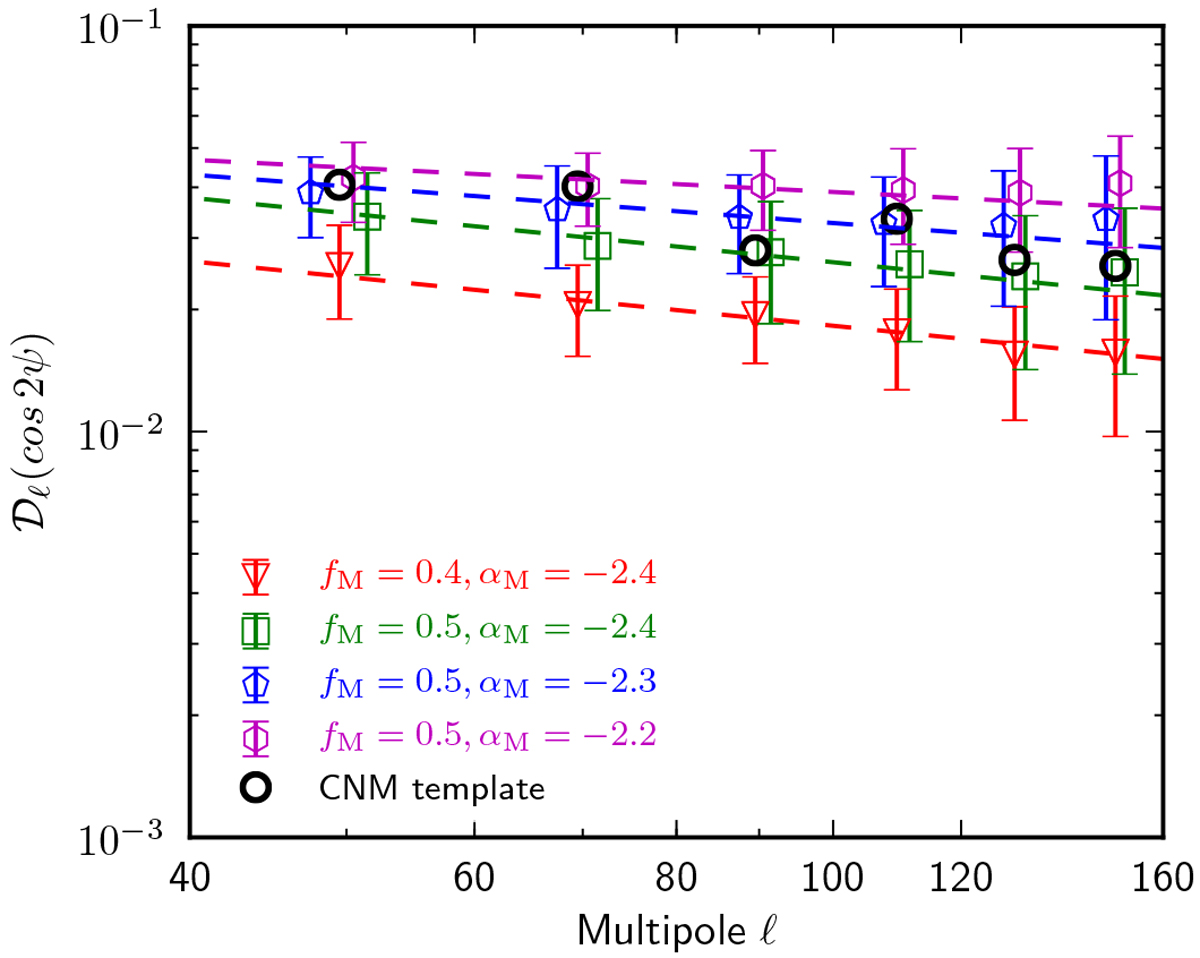
Means of power spectrum amplitudes from simulated model maps of cos2ψ within the multipole range 40 ≤ ℓ ≤ 160 for different values of fM and αM and the best-fit power laws (dashed lines). The error bars (1 σ) are standard deviations computed from 100 realisations. Black circles are power spectrum amplitudes from the map of cos 2ψc computed from the CNM template.
Current usage metrics show cumulative count of Article Views (full-text article views including HTML views, PDF and ePub downloads, according to the available data) and Abstracts Views on Vision4Press platform.
Data correspond to usage on the plateform after 2015. The current usage metrics is available 48-96 hours after online publication and is updated daily on week days.
Initial download of the metrics may take a while.