Fig. 6
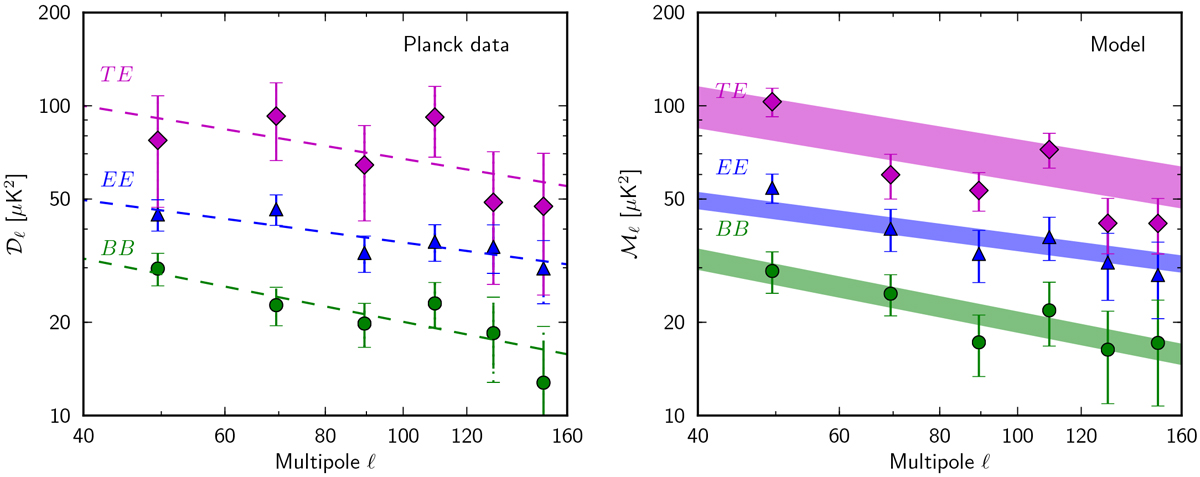
Left panel: dust EE, BB, and TE cross-power spectra computed from the subsets of Planck data at 353 GHz over mask65. Dashed lines represent the best-fit power laws. Right panel: similar plots as left panel computed from 100 realisations of the dust model maps. Error bars are 1 σ uncertainties as explained in the main text. The filled areas represent the Planck dust power spectra measurements over mask65.
Current usage metrics show cumulative count of Article Views (full-text article views including HTML views, PDF and ePub downloads, according to the available data) and Abstracts Views on Vision4Press platform.
Data correspond to usage on the plateform after 2015. The current usage metrics is available 48-96 hours after online publication and is updated daily on week days.
Initial download of the metrics may take a while.