Fig. 6
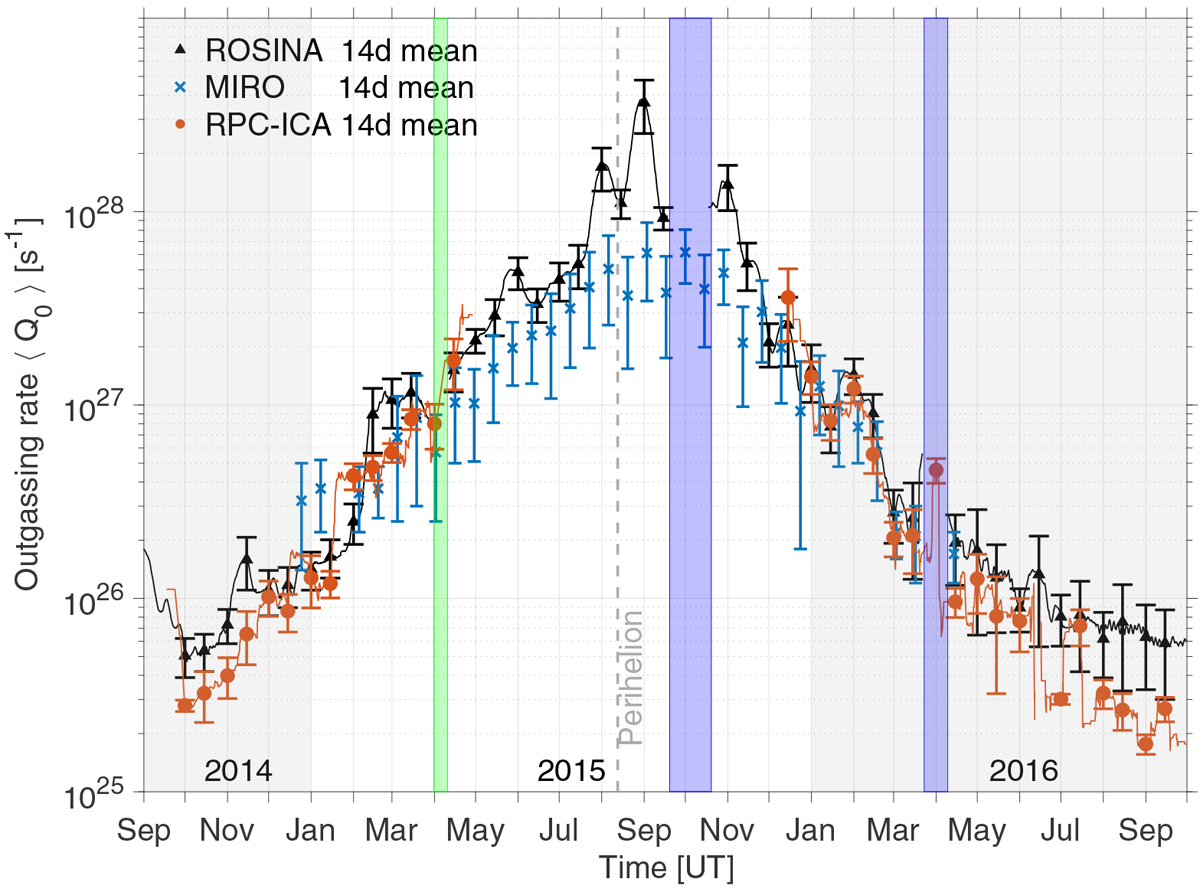
Local 14-day averaged water outgassing rate of comet 67P during the Rosetta mission (2014-2016), as measured by ROSINA-COPS (black line and triangles), MIRO (blue crosses, from Marshall et al. 2017), and retrieved from RPC-ICA (red line and circles, tabulated in Table 1). Error bars correspond to the median absolute standard deviations. Colored regions denote spacecraft excursions and safe modes, as in Fig. 5.
Current usage metrics show cumulative count of Article Views (full-text article views including HTML views, PDF and ePub downloads, according to the available data) and Abstracts Views on Vision4Press platform.
Data correspond to usage on the plateform after 2015. The current usage metrics is available 48-96 hours after online publication and is updated daily on week days.
Initial download of the metrics may take a while.