Fig. 10
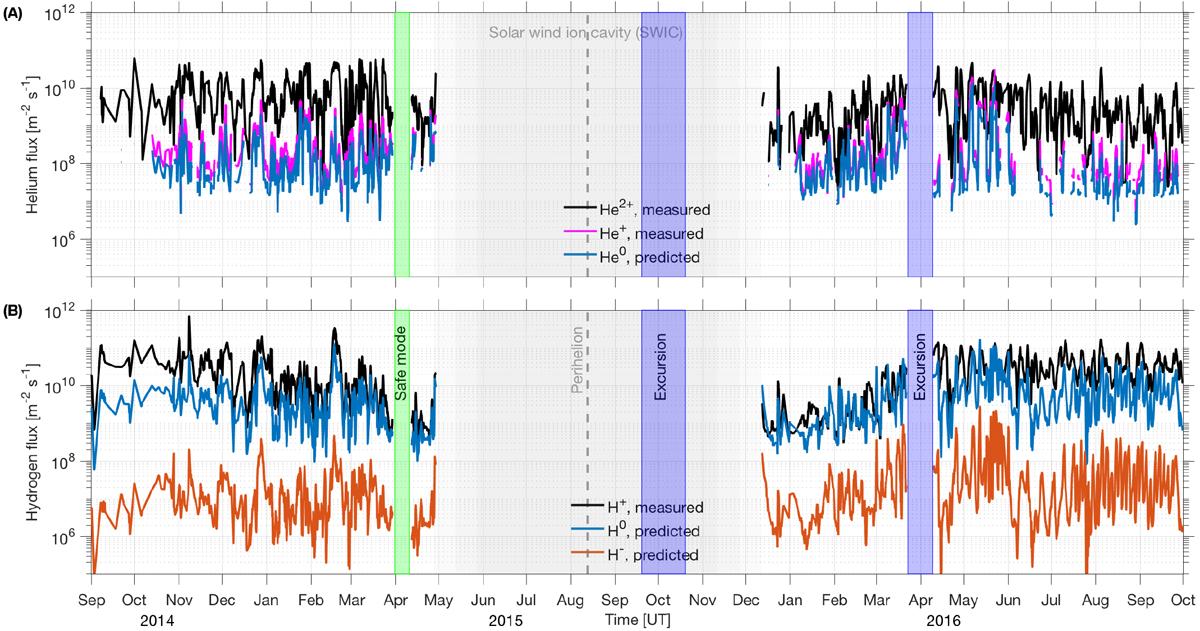
Solarwind ion and ENA fluxes during the Rosetta mission 2014–2016. The fluxes are measured when available by RPC-ICA, and when unavailable, are predicted by the analytical model using ROSINA-COPS and RPC-ICA data. All fluxes are averaged over 24 h. (A) Helium species. (B) Hydrogen species. ENA fluxes are drawn in blue for clarity. The solar wind ion cavity is indicated as a gray-shaded region. Safe mode and excursions where ROSINA data were excluded from the analysis are indicated.
Current usage metrics show cumulative count of Article Views (full-text article views including HTML views, PDF and ePub downloads, according to the available data) and Abstracts Views on Vision4Press platform.
Data correspond to usage on the plateform after 2015. The current usage metrics is available 48-96 hours after online publication and is updated daily on week days.
Initial download of the metrics may take a while.