Fig. 2.
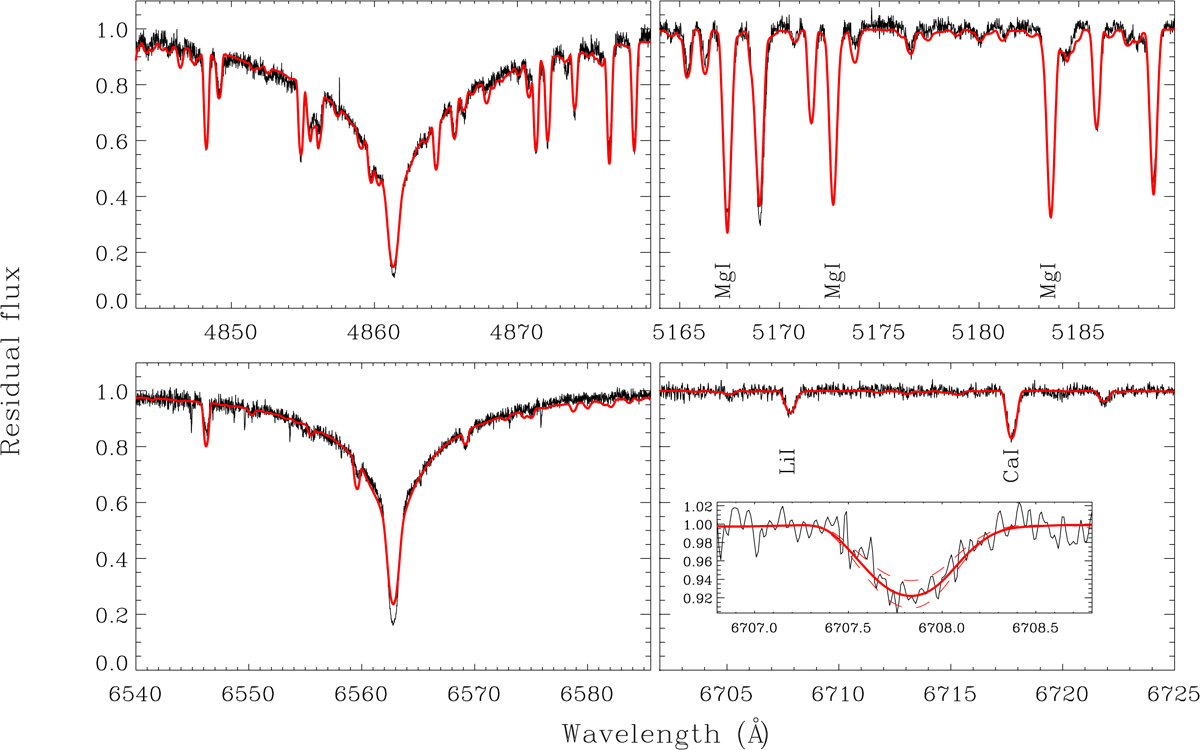
Comparison between the spectrum of V363 Cas obtained on November 26, 2019 (black line), and the synthetic spectrum (red line) in four main spectral intervals centred on Hβ (top left panel), the Mg I triplet at λλ5167.3216, 5172.6843, and 5183.6042 Å (top right panel), Hα (bottom left panel), and the Li I line at 6707.766 Å (bottom right panel), respectively. In the inset, a solid red line shows the fit of the lithium line, and dashed lines represent limits for the experimental error (δ = ± 0.1 dex).
Current usage metrics show cumulative count of Article Views (full-text article views including HTML views, PDF and ePub downloads, according to the available data) and Abstracts Views on Vision4Press platform.
Data correspond to usage on the plateform after 2015. The current usage metrics is available 48-96 hours after online publication and is updated daily on week days.
Initial download of the metrics may take a while.