Fig. 4
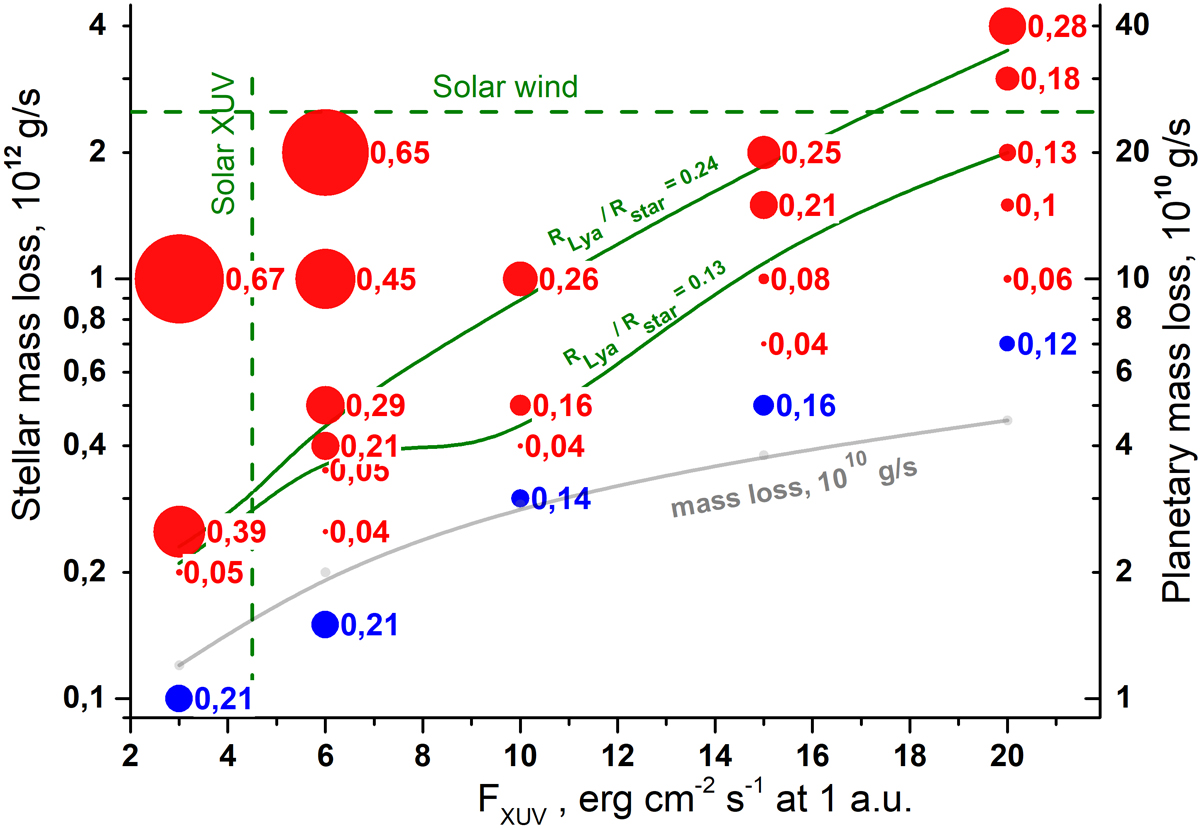
Planetary Lyα absorption in Rp,Lyα/Rstar integrated inthe [−215,−91] km s−1 velocity range as a function of stellar XUV flux (at 1 AU; x-axis) and input stellar mass-loss rate (left y-axis). Red circles indicate the results obtained with a SW temperature and terminal velocity of 0.64 MK and 400 km s−1, respectively. Blue circles are for a SW temperature and terminal velocity of 1.2 MK and 800 km s−1, respectively.The size of the red circles is proportional to the planetary absorption, whose value is given beside each circle. For a comparison with the observations, the green solid lines show the approximate position of the 0.13 and 0.24 absorption levels with respect to the results given by the red circles. The gray curve gives the planetary mass-loss rate (right y-axis) obtained from the simulations as a function of stellar XUV flux in the case of the slow SW. The planetary mass-loss rate is very weakly dependent of the stellar mass-loss rate (see Sect. 4).
Current usage metrics show cumulative count of Article Views (full-text article views including HTML views, PDF and ePub downloads, according to the available data) and Abstracts Views on Vision4Press platform.
Data correspond to usage on the plateform after 2015. The current usage metrics is available 48-96 hours after online publication and is updated daily on week days.
Initial download of the metrics may take a while.