Fig. 3
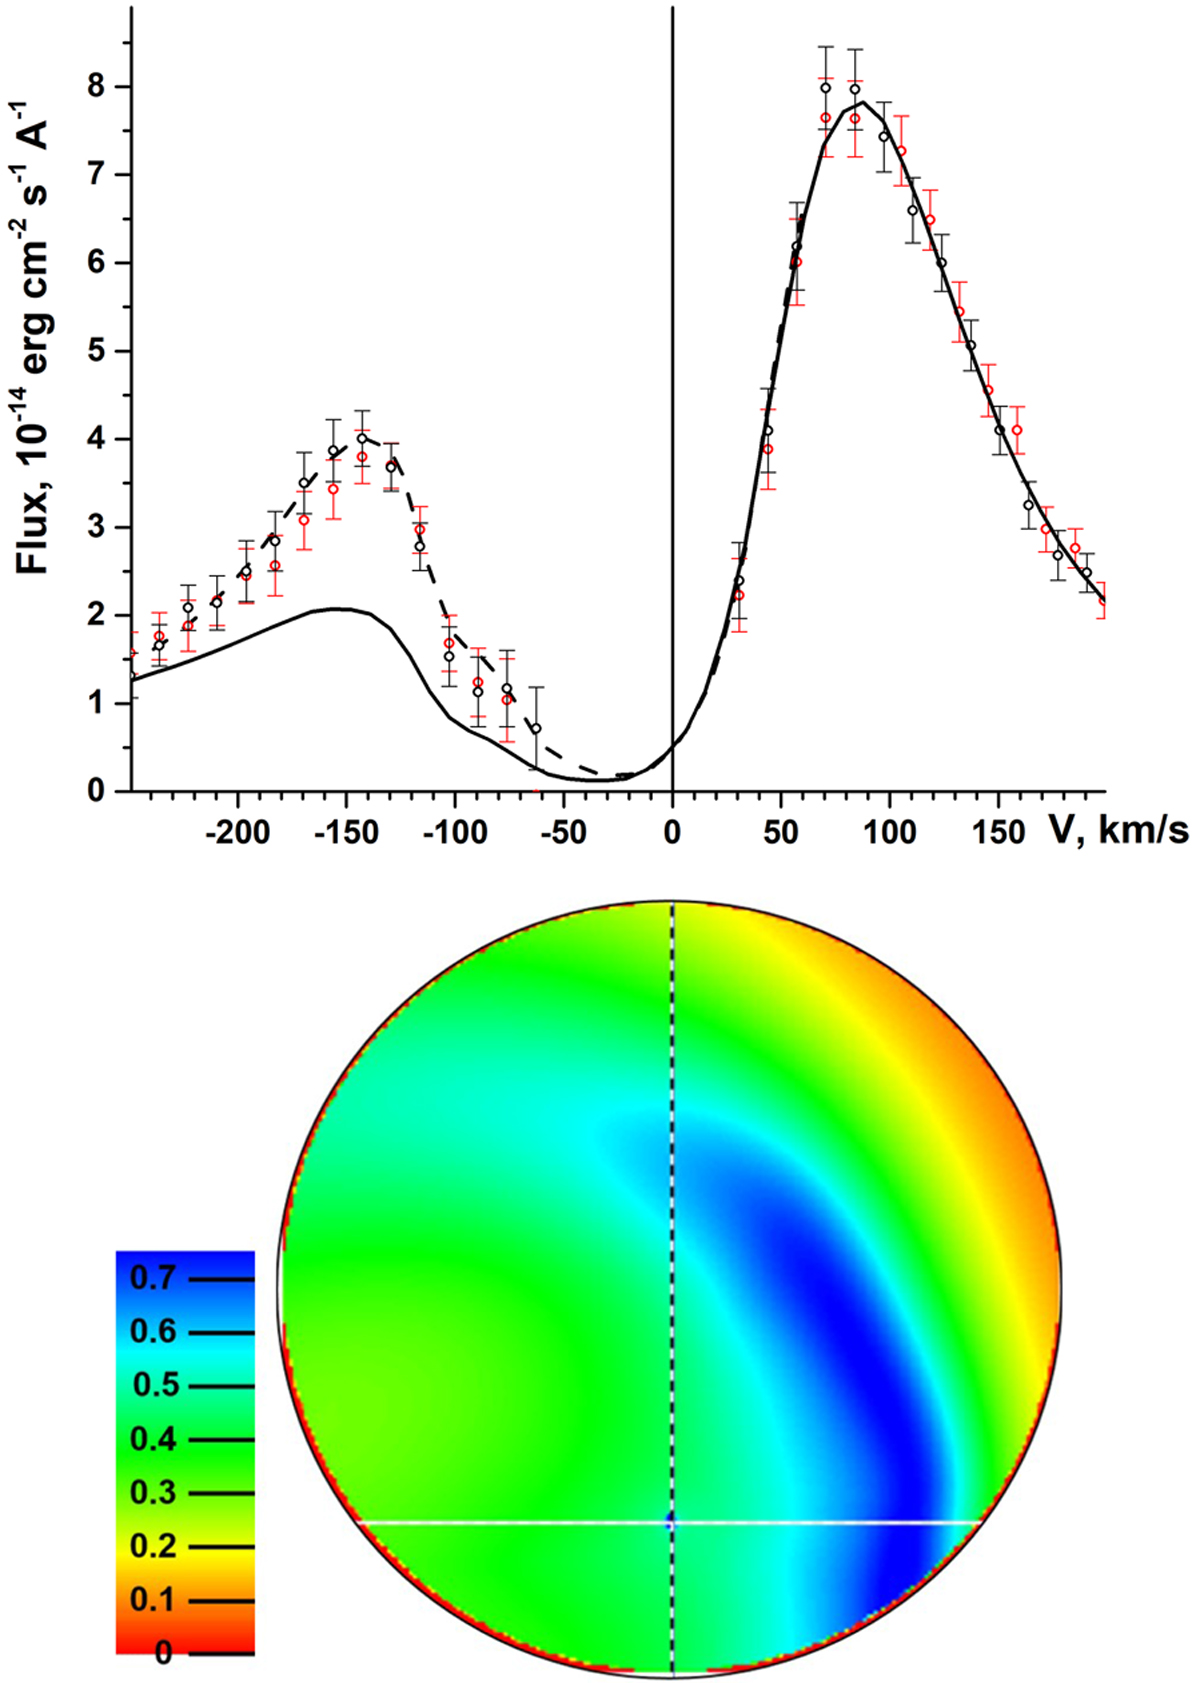
Top: out-of-transit (black circles) and in-transit (red circles) observed Lyα profiles (from García Muñoz et al. 2020). The dashed line shows the synthetic in-transit Lyα profile obtained from the simulation computed under the weak SW conditions (i.e. top-left panel in Fig. 1), while the solid line is for the simulation computed with the moderate SW (i.e. top-right and bottom panels of Fig. 1). Of the two simulations represented in this figure, only the weak SW case is consistent with the HST non-detection. Bottom: distribution of the Lyα absorption along the line of sight averaged over the blue wing of the line, in the [−215,−91] km s−1 velocity range, as seen by a remote observer at mid-transit and considering the moderate SW. The absorption ranges between 0 and 1, where 0 means no absorption, while 1 means full absorption. The black circle at the outer boundary indicates the star and the white horizontal line shows the planetary orbital path accounting for the impact parameter (as the planet moves from left to right). At mid-transit, the planet is located at the intersection of the horizontal white solid line and of the vertical dashed black line.
Current usage metrics show cumulative count of Article Views (full-text article views including HTML views, PDF and ePub downloads, according to the available data) and Abstracts Views on Vision4Press platform.
Data correspond to usage on the plateform after 2015. The current usage metrics is available 48-96 hours after online publication and is updated daily on week days.
Initial download of the metrics may take a while.