Fig. 2
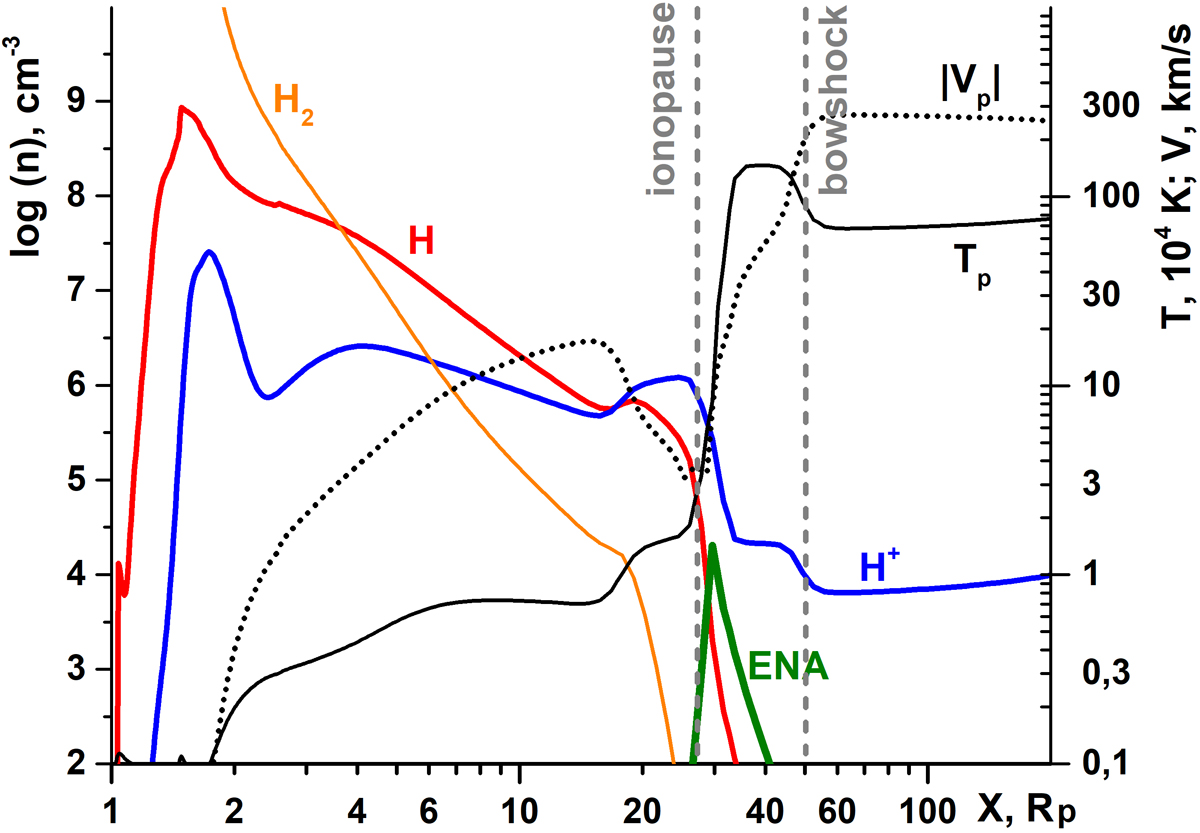
Distribution profiles of major species along the planet-star line obtained in the simulation with the moderate SW (i.e. top-right and bottom panels of Fig. 1). The left axis is for the density (in log[cm−3]) of H2 (orange line), H (red line), H+ (blue line), and ENAs (green line). The right axis is for the proton temperature (in 104 K; black solid line) and velocity (in km s−1; dotted line). The vertical dashed lines indicate the approximate positions of the ionopause and of the bow shock. The planet lies at X = 0, while the star is located to the right.
Current usage metrics show cumulative count of Article Views (full-text article views including HTML views, PDF and ePub downloads, according to the available data) and Abstracts Views on Vision4Press platform.
Data correspond to usage on the plateform after 2015. The current usage metrics is available 48-96 hours after online publication and is updated daily on week days.
Initial download of the metrics may take a while.