Free Access
Fig. 9.
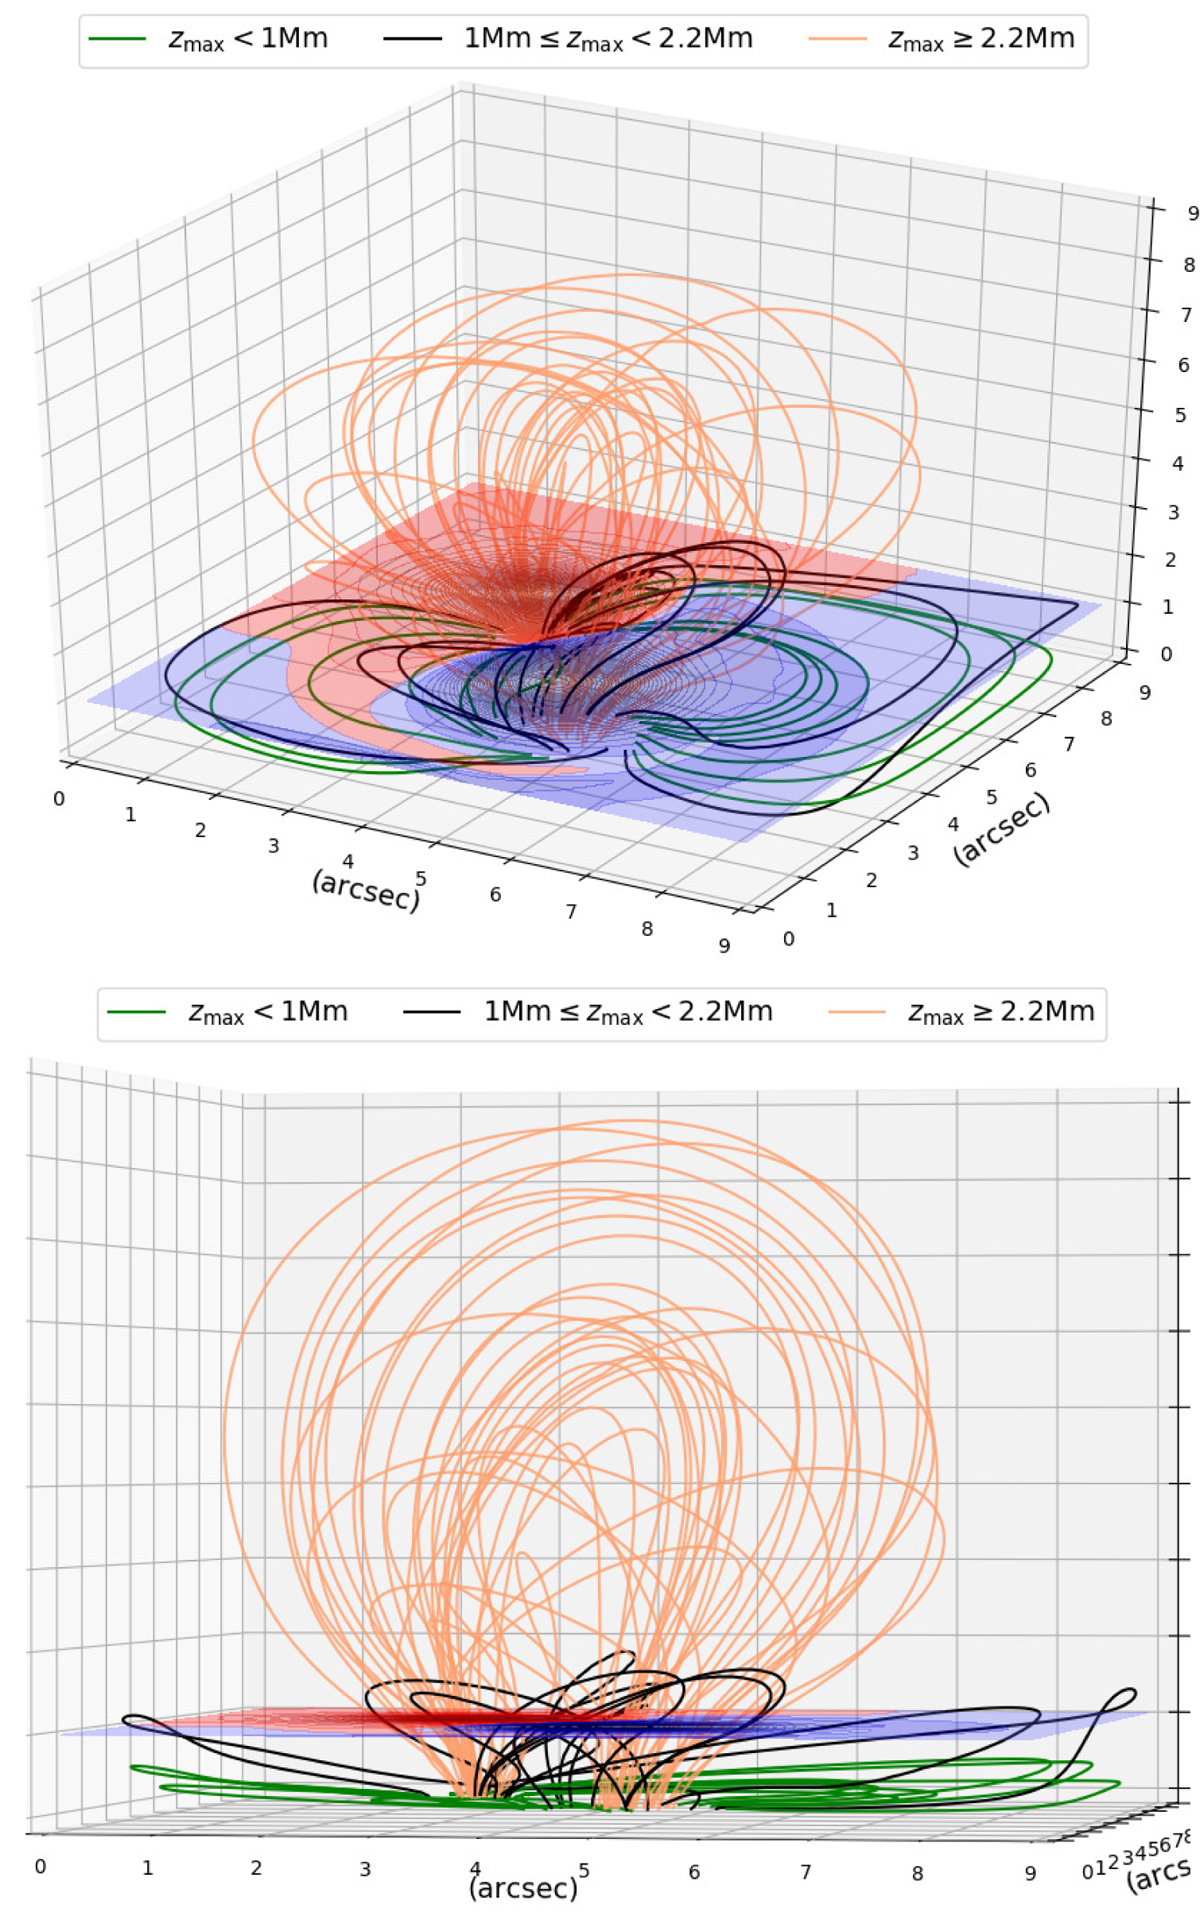
3D magnetic field configuration inferred from the 3D MHD simulation. The red- and blue-filled contours show the LOS magnetic flux at chromospheric height with red and blue representing positive and negative flux, respectively. A selection of magnetic field lines are traced.
Current usage metrics show cumulative count of Article Views (full-text article views including HTML views, PDF and ePub downloads, according to the available data) and Abstracts Views on Vision4Press platform.
Data correspond to usage on the plateform after 2015. The current usage metrics is available 48-96 hours after online publication and is updated daily on week days.
Initial download of the metrics may take a while.