Fig. 8.
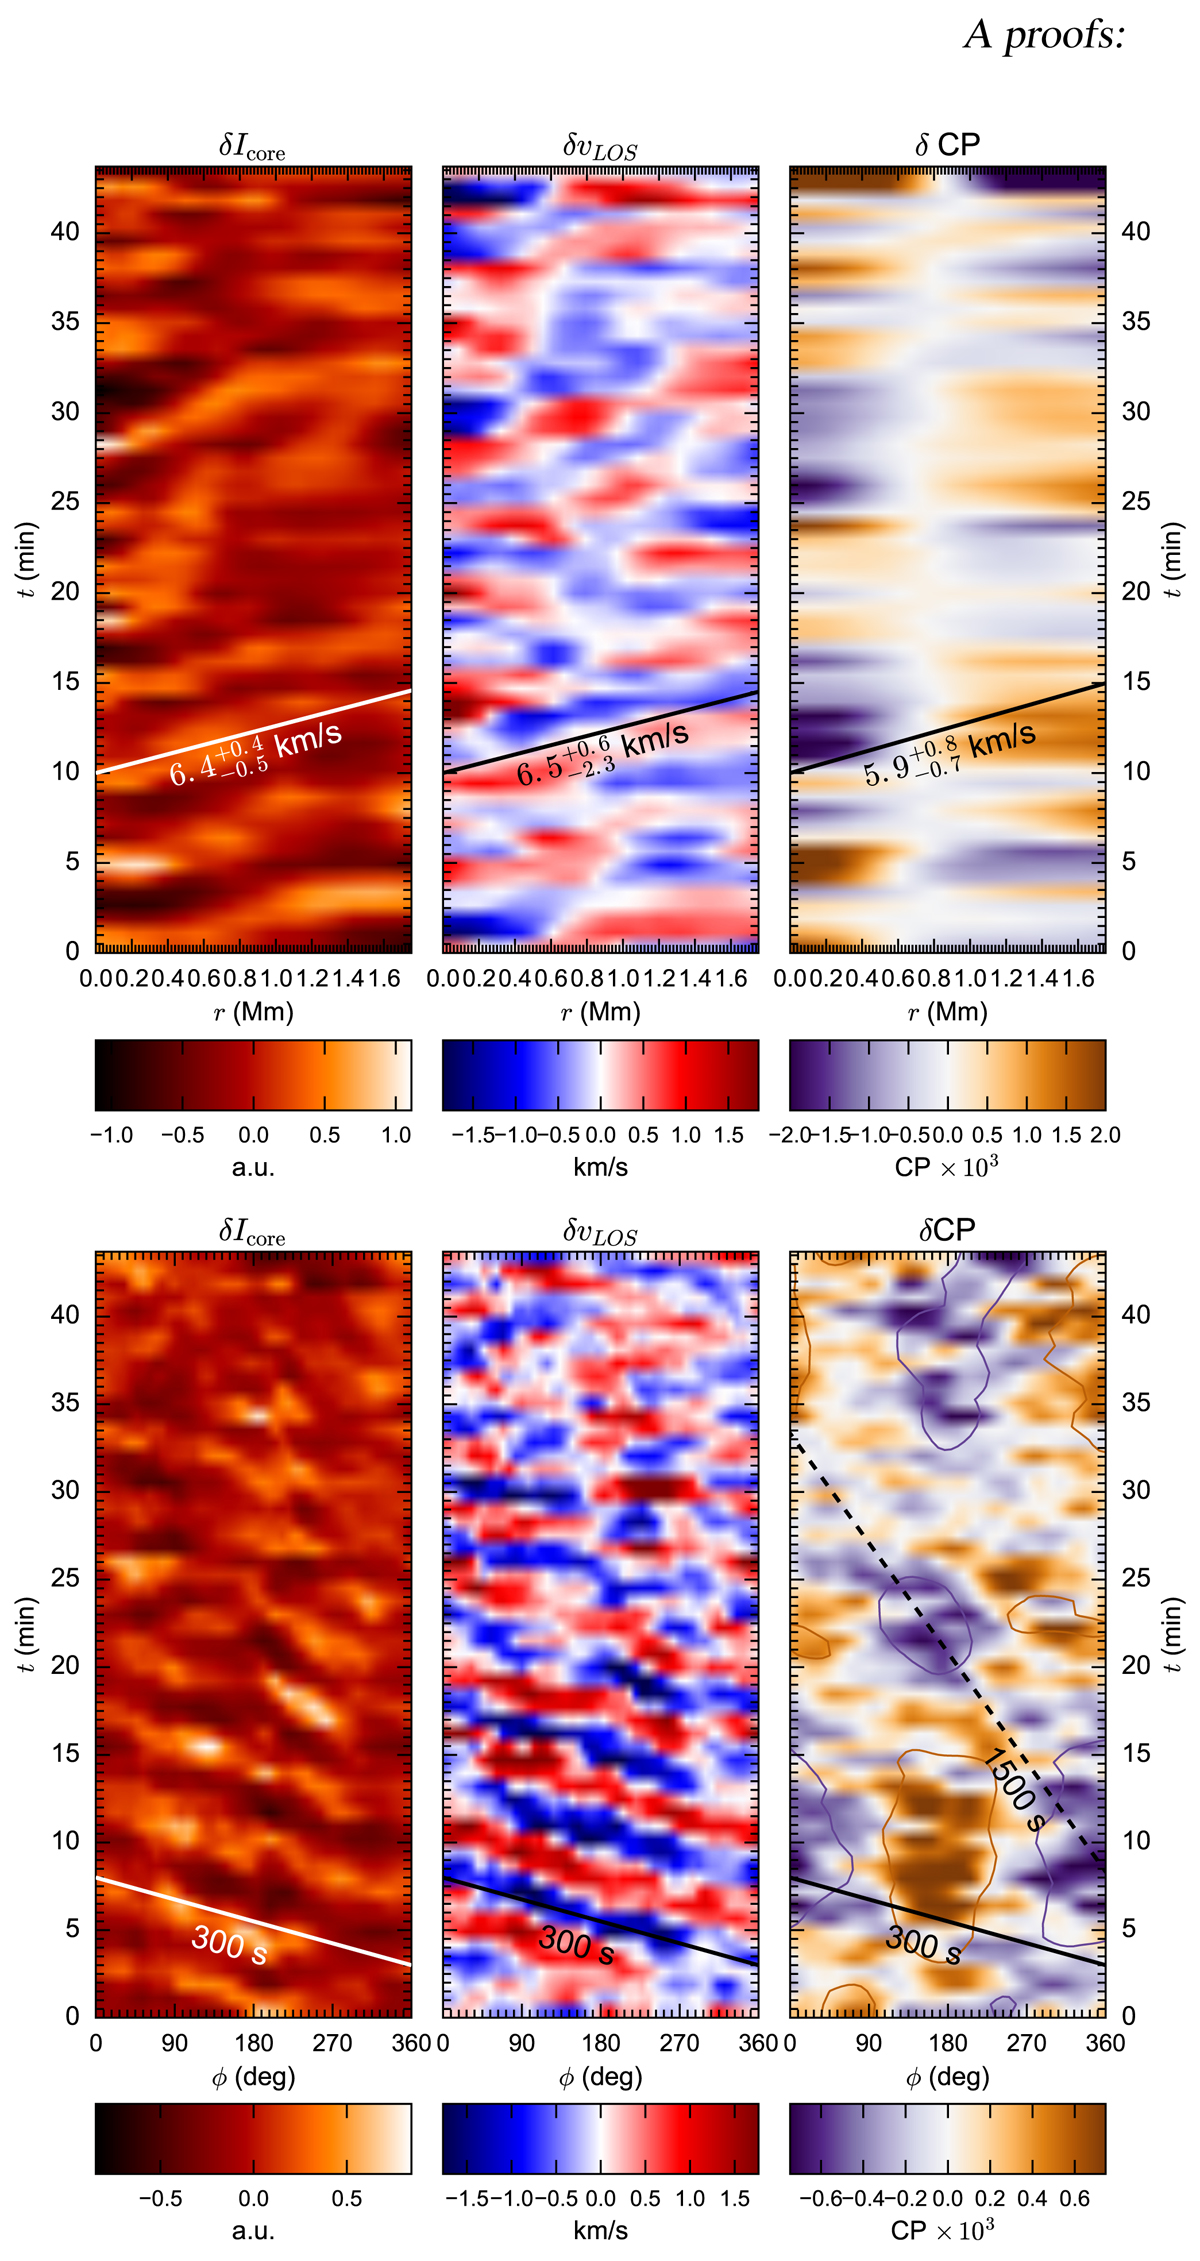
Top panel: perturbations as a function of radial distance and time in intensity (left), LOS Doppler velocity (middle), and CP (right) in Ca II in a polar grid centered on N and averaged over azimuthal angle. The line highlights the phase propagation of the five-minute wave pattern with the speed from lag analysis. Bottom panel: perturbations in intensity (left), LOS Doppler velocity (middle), and CP (right) as a function of angle and time in a polar grid centered on S and averaged over radius. The line highlights the phase propagation of the wave patterns with their corresponding periodicity. A movie of the data filtered around 5 min is available online.
Current usage metrics show cumulative count of Article Views (full-text article views including HTML views, PDF and ePub downloads, according to the available data) and Abstracts Views on Vision4Press platform.
Data correspond to usage on the plateform after 2015. The current usage metrics is available 48-96 hours after online publication and is updated daily on week days.
Initial download of the metrics may take a while.