Free Access
Fig. 4.
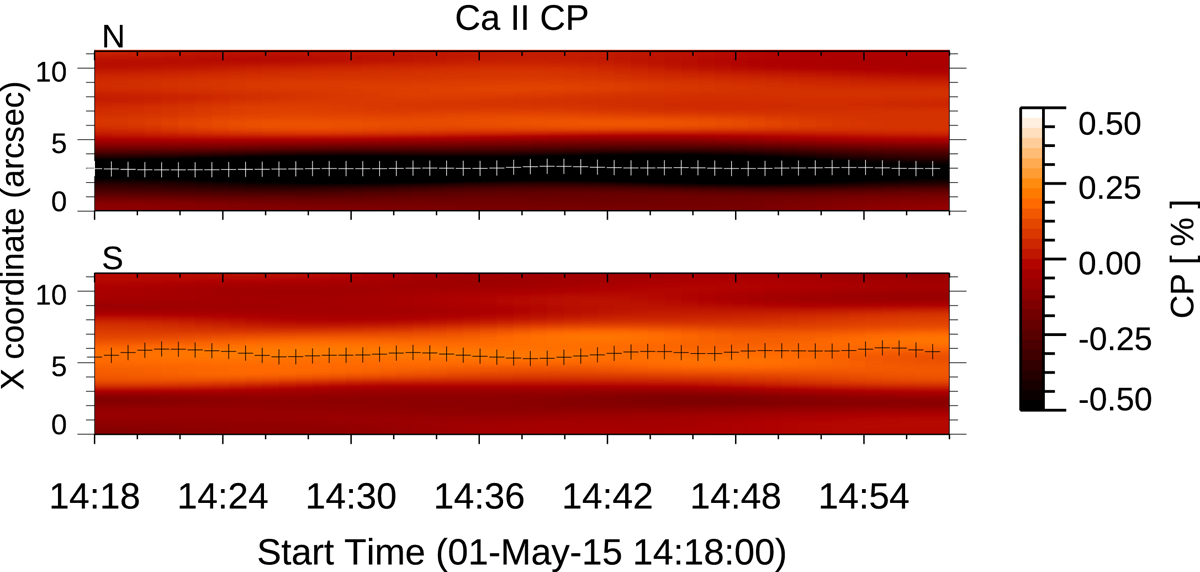
Time-distance plot of the chromospheric circular polarisation along a cut at the centre of the two studied structures. The x-position of the barycentre of each structure is overplotted with a plus symbol. A Gaussian filter is applied to these plots.
Current usage metrics show cumulative count of Article Views (full-text article views including HTML views, PDF and ePub downloads, according to the available data) and Abstracts Views on Vision4Press platform.
Data correspond to usage on the plateform after 2015. The current usage metrics is available 48-96 hours after online publication and is updated daily on week days.
Initial download of the metrics may take a while.