Fig. 3.
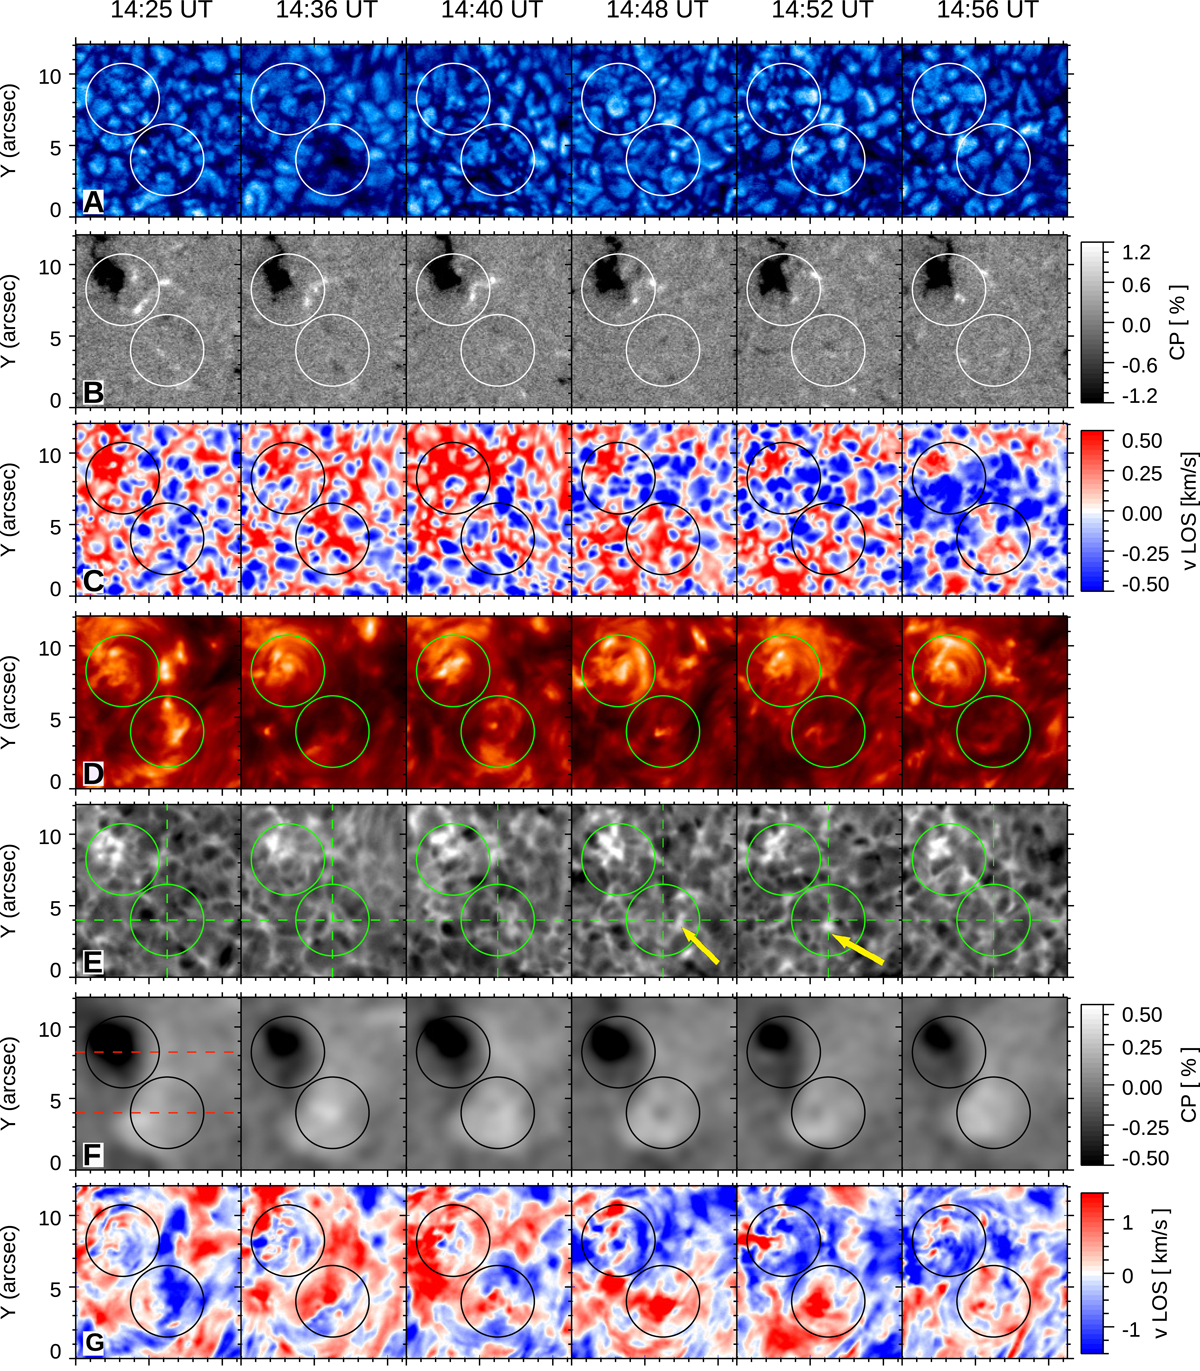
Panels A–C: continuum intensity, CP maps, and LOS filtered velocity map from Fe I line measurements. Panels D–G: line core intensity, line blue wing, CP maps, and LOS velocity maps from Ca II line measurements. Down–flow and up–flow correspond to positive and negative velocities, respectively. A Gaussian filter is applied to the chromospheric CP maps (panel F). The dashed horizontal lines indicate the slices where the time slice is computed (see Sect. 2 for more details). A movie of the data presented in this figure is available online.
Current usage metrics show cumulative count of Article Views (full-text article views including HTML views, PDF and ePub downloads, according to the available data) and Abstracts Views on Vision4Press platform.
Data correspond to usage on the plateform after 2015. The current usage metrics is available 48-96 hours after online publication and is updated daily on week days.
Initial download of the metrics may take a while.