Fig. 1.
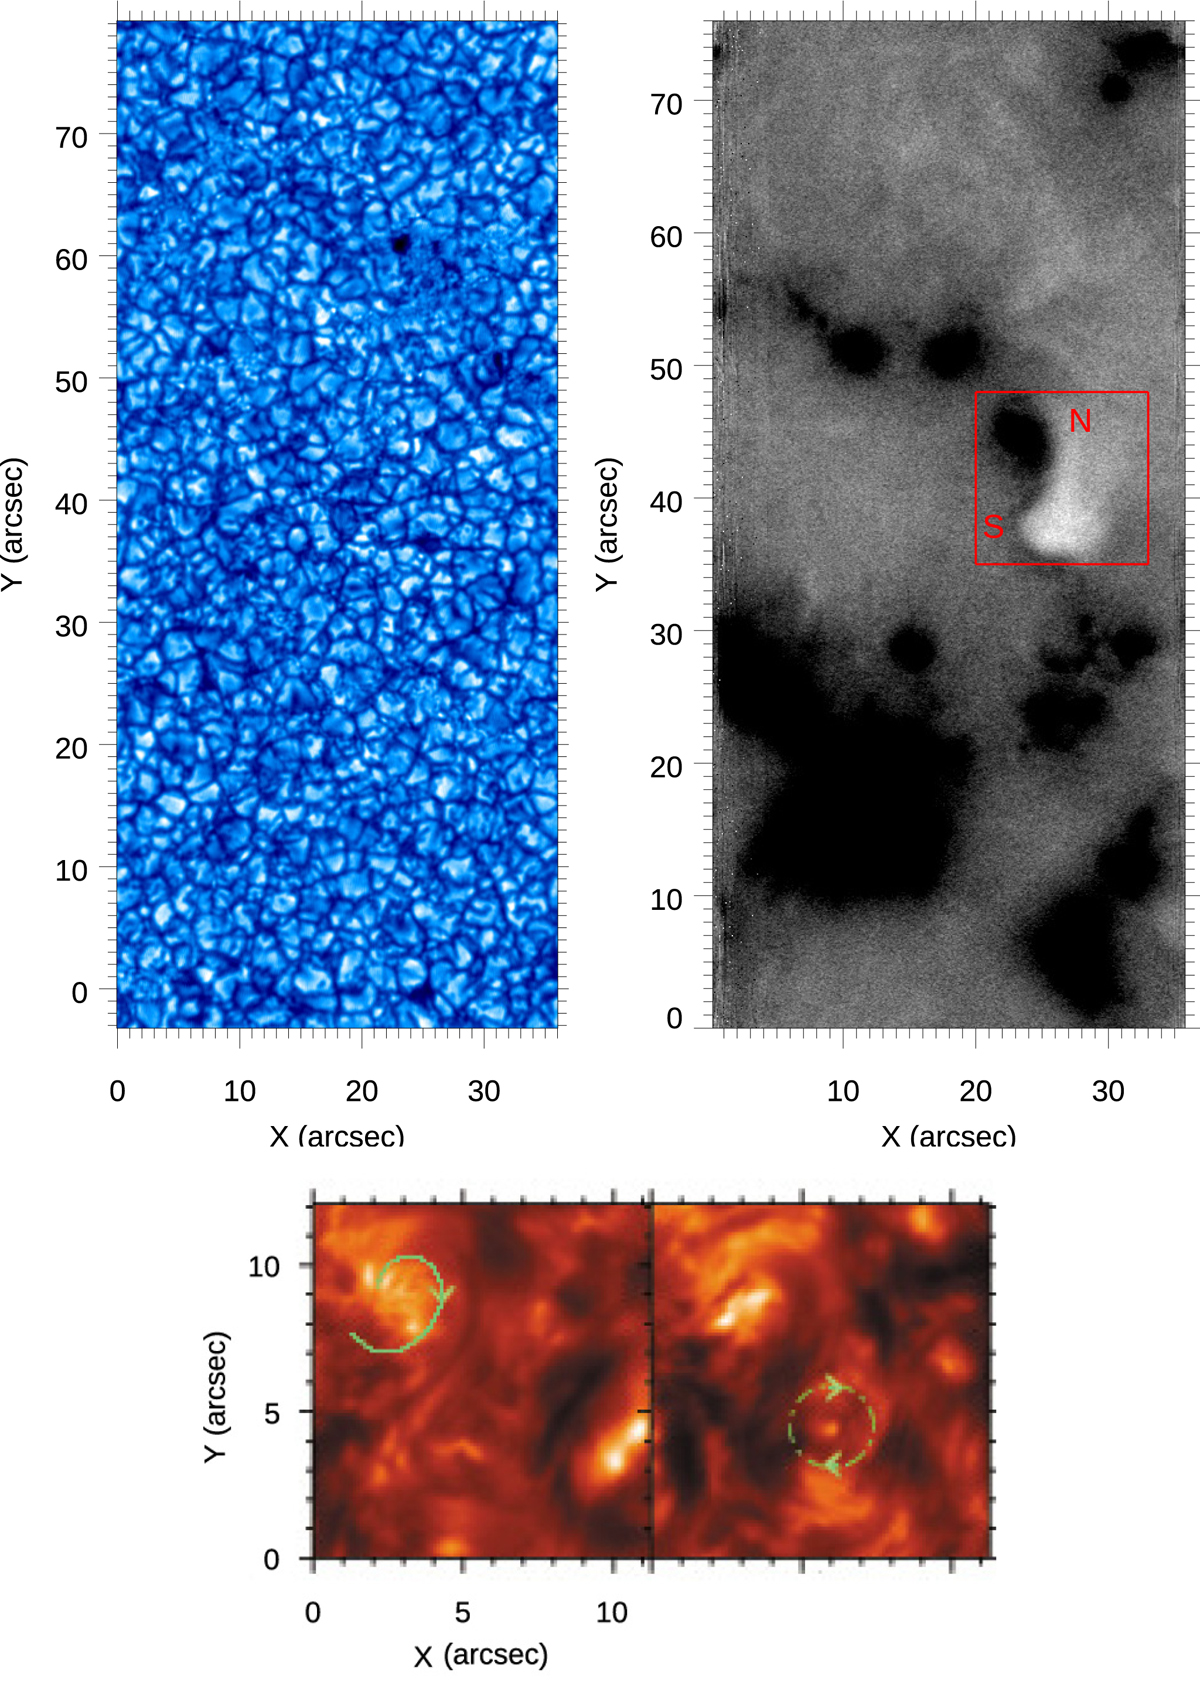
Top left: white-light image at 6333 Å of the IBIS FOV at 14:20 UT. Top right: mean CP map from IBIS Ca II 8542 Å data. The signal in the CP map has been saturated to enhance contrast. Bottom: Ca II core snapshots with curves to emphasise the rotation pattern in the two structures, following the classification by Wedemeyer-Böhm & Rouppe van der Voort (2009).
Current usage metrics show cumulative count of Article Views (full-text article views including HTML views, PDF and ePub downloads, according to the available data) and Abstracts Views on Vision4Press platform.
Data correspond to usage on the plateform after 2015. The current usage metrics is available 48-96 hours after online publication and is updated daily on week days.
Initial download of the metrics may take a while.